The Indomitable Human Spirit

By Edward Lim

3 Jan 2023

This year’s World Cup final was the best final I have ever seen in any football finale, only equal with the 2005 Champions League game in Istanbul between Liverpool and Milan. I was watching the game with a friend who supports France and in the 79th minute, he said that he was going home since we have both assumed that there was no way France could have scored two goals in the last 11 minutes in what has been an almost one-sided and commanding display by the Argentinian team. I rebuked him and coaxed him to just see out the final minutes as respect for The GOAT that has given us so much joy over so many years. Who would have thought not only did France score a goal in the 80th minute but equalized in the 81st minute and took the final into extra time and the dreaded penalty kicks. This exhilarating final taught me an important maxim in life “The human spirit is never finished when it is defeated, it is finished when it surrenders.” Bob Stein.

2022 has been a torrid year for many asset classes. Only the energy complexes are up with the GSCI index up 26% though it has given up half of its return since peaking in Jun. Long-duration assets such as long-dated government bonds and tech-heavy NASDAQ were the major losers as yields across the entire tenure rose in synchrony with central banks tightening their monetary policy in their belated attempt to quell inflation. With every major equity index and every fixed income sub-asset class registering declines, many are questioning if the traditional 60/40 equities/bond portfolio is dead as the correlation of both asset classes converges and all semblance of diversification vanishes. However, we disagree with this notion and will be spending much of this Navigator elaborating our view. Some important and factual perspectives first to highlight 2022 exceptionalism:

  1. Since 1900, US Treasury has only registered a negative returns 25 times in 122 years. The 2022 decline in US Treasury by -12% was the worst on record, with a distant second -8% drop in 1931 and 1994.
  2. There has only been 8 times in these 122 years when bonds declined alongside negative returns in equities rendering bonds useless as a portfolio diversifier.
  3. For a 60/40 Equity/Bond portfolio, 2022 is also the third worst declining -18%, only after 2008 GFC -20% and -24% in 1932 during the Great Depression era.

One of worst the performances in many decades

The 3rd worst 60/40 performance in 122 years

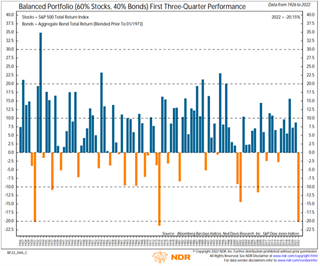
However, looking at 122 years of data, we observe that such positive correlations with negative outcomes for both bonds and equities like what we have seen in 2022 are quite rare and even rarer to repeat in the next consecutive year.

  1. Of the ten worst yearly 60/40 performances, nine out of ten years, the subsequent year returns are positive. The median decline of the ten worst 60/40 performance was -16% but the median return in the following year is +17%.
  2. Moreover, there has never been a year when both equities and bonds declined for two years in a row.
  3. If we look at the three worst performances of 60/40 portfolio which have similar magnitude of 2022 decline, the subsequent 2 years of returns have significant positive outcomes.
    • The worst 60/40 performance was in 1932 which fell -24%, but the following years’ returns were +35% in 1933 and +27% in 1934.
    • In 2008, the 60/40 portfolio declined -20% but in 2009 and 2010, the portfolio returned 10% pa each year.
    • The third worst 60/40 performance was in 1974 the decline of -18% was followed by +20% and +18% returns in 1975 and 1976 respectively.
    • It is worth highlighting that none of these three worst years saw both equities and bonds declined. The losses were driven entirely by losses in equity.

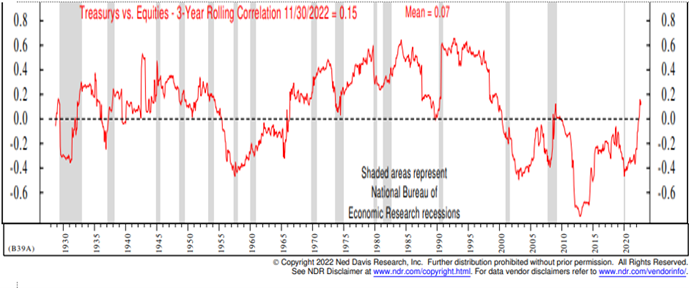
Aside from the above empirical evidence that refutes the notion equity and bond correlate often with negative returns, we took another step further to understand why and when the correlation is positive or negative. We look at their correlation relationship from 1930 onwards and we overlayed the macro-dynamics corresponding to those periods. Several important takeaways from this study.

  1. An investor with a longer investment horizon (3 years and longer) will benefit more from the diversification benefits that equities versus bonds offer. The current correlation between bonds and equities is low at 0.15 and 0.02 over a longer investment horizon of 3 and 5 years respectively. But the correlation is high at 0.52 on a shorter horizon (1 year). Hence, you will often hear from your advisor recommending that you take a longer investment horizon of 3 to 5 years when considering putting capital into the market. It is also no coincidence 3 to 5 years is the typical duration of an economic cycle.

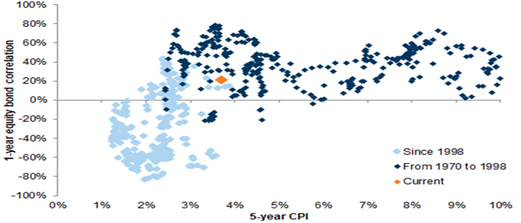
    Equity/Bond correlations are +ve in short-term, but longer term remains -ve providing diversification benefits

  2. There have been long periods when the correlation is negative or positive. Correlation during the Great Depression till 1950 was positive. But in the subsequent 30 years, it turned negative in part due to rebuilding efforts after WW2 leading to the roaring 50-60s. In the next 30 years from 1970-2000, the correlation reverted to positive as inflation and then stagflation hurt bonds and was also marked by the era of deficit spending under Reganomics. The Great Moderation from 2000 until 2021, correlation was negative again as inflation was benign. Inflation during this period was subdued as a confluence of factors such as aging demographics, dwindling power of labour, an acceleration in globalization, technological advancements, and gains in productivity came into play.

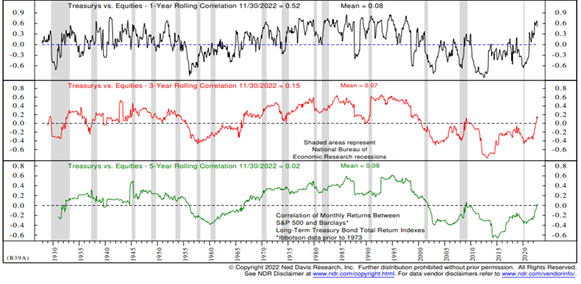
    Four distinct periods of correlation changes since 1930

  3. We found the overarching factor that governs the correlation relationship between bonds and equities has been the level of inflation. Correlations between these 2 distinct asset classes is positive when inflation is high like in the 1970s and in between Great Depression till WW2. When inflation is high, the terminal Fed fund rate rises as central banks attempt to cool inflation. However, when inflation is benign and deflation is a bigger issue, higher yields during this period signify faster economic growth, hence correlation is negative which was what happened in the period post WW2 until 1970 and most recently 2000-2021. The chart below shows the correlation converges when inflation is high (loosely defined as above 4%) and vice versa. The dot plots also correspond to the periods I have ascribed above. The low inflation era from 2000 onwards (blue dots) where correlation is negative but in the era of high inflation (1970-2000), correlation became positive.

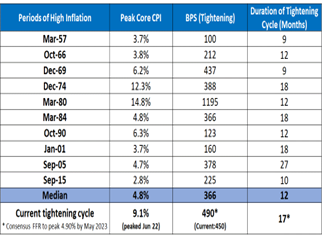
    The level of inflation determines the correlation between bonds and equities (Source: Goldman Sachs)

This segues to the important topic of inflation. As we have mentioned for several quarters now, our main concern is not inflation but growth. In our last Navigator back in October, Don’t call the car mechanic when it is the bathroom that is leaking, we zoomed into four facets that have been the key contributors of inflation: Supply chain bottlenecks, commodities shock, undersupply of housing leading to pressure on rent, and rising wages. The latest data reinforces our view inflation will fall precipitously in the coming quarters. Supply chain indicators such as Fed Supply Chain Pressure Index is close to reversing all the stress since the start of 2021. The Shanghai Container Freight Index is has declined by 78% yoy while Bulk rates for commodities is -32% yoy. Price pressures are abating as well when we look at the PMI surveys for price inputs of manufacturing and services with the latter now trending into negative yoy growth similar to what we have seen for manufacturing several months ago. 

Supply chain indicators have completely eased, resulting in lower input prices.

PMI for survey for manufacturing and services Input Prices are now registering negative yoy growth

Regarding the energy complexes, oil and US pump prices are now only a single digit up from last year’s level, and on a rolling 3-month basis the change is negative -9 to -11%. The decline in momentum is even more pronounced when you consider that oil inventory is below norm while spare capacity available within the OPEC+ is low. It reinforces our view growth and not inflation is the primary issue. Natural Gas is still up 14-22% yoy for America and Europe but they have retreated more than 50% from its peak back in July. No doubt the current situation for energy remains volatile and will require continuous monitoring but the trends in the last few months augurs well for inflation outlook for the near future.

Energy complex are now only single digit up for the year and have given up significant gains off the peaks

The overall Food and Agriculture prices change on a yoy basis is now -0.3%, while the overall soft commodities index is now -11% yoy. Wheat, which exemplifies the Russia terror on Ukriane, is now flat for the year giving up all of its 40% gains at the peak in March.

Food supply normalizing and food prices coming off

Home prices in the US have already peaked and is rolling over and we have cited this weakening in housing prices is not just in the US but in many other economies such as Canada, Australia, UK, Germany, China and Korea. In the US, the chronic shortage of housing inventory has improved as inventory doubled from a low of barely two months throughout much of 2021-2022 to 4.1 months, just 2 months short of its long-term average of 6 months. Home Prices are no longer rising faster than housing rent and our high-frequency rental indicators, which lead CPI-Shelter by 6 to 9 months, are tracking a much lower increase of 0-5% versus as gains of 15-30% yoy in 4Q21-1Q22.

Housing data that leads housing inflation by 6-9 months are improving

The market spends too much time looking for cues of wage pressure through the jobless claims and unemployment rate data releases. There are lagging indicators and instead we choose to focus on job openings and layoffs. Anyone who runs a business will know the hiring down cycle commences with fewer openings for both new and attrition hires, subsequently the wages of existing workers will be frozen, and when these measures are still not enough, layoff of excess labour will ensue alongside cuts in wages. Furthermore, just looking at the broad unemployment rate and jobless claims data fails to recognize the bifurcation of employment and wage growth between blue- and white-collar jobs that has been characteristic of this pandemic. The Challenger Job Hiring data has peaked three months ago while the announcement of job cuts is at the highest since Jan 2021. The gap between jobs hiring and cuts has turned negative in November of -46,600 jobs; the first time since the pandemic started. Our base case is for wages growth to revert to the norm of 3-4% by end of 2023.

Hiring has peaked and job cuts increasing. More jobs lost than openings availed

The weight of evidence supports our views that inflation should fall across all the major drivers in the next 6 months. This leads us to believe the positive correlation between equities and bonds has peaked in the near term. As for the longer term, most of the drivers of deflation remain relevant particularly ageing demographics, lack of labour bargaining power, and technological advancements. We add another factor that will depress consumption and concomitantly inflation, ie is the high level of government debt across many nations. However, as we have pointed out in our January 2021 webinar, After the storm, what comes next? other deflationary forces are reversing. Presciently, we stated that globalization has peaked and is replaced with friend shoring which should lead to higher prices. China becomes the net exporter of inflation instead of deflation as its costs level up. The cadence of the e-commerce penetration should slow from hereon, while the adoption of ESG will be expensive in the near term.

Asset Allocation Strategy 

Our base case assumption in managing portfolios is that a global recession is inevitable in the near term and arguably we could be in one now if not for arbitrary semantics. The Survey of Professional Forecasters thinks the probability of recession in the next 12 months is the highest it has ever been since 1970. The level of the yield curve invversion is now at its signaling threshold of a recession as well. The difficulty for us is to assess the severity of this impending recession. NDR attempts to guesstimate the severity of recession by analyzing a host of coincidental economic indicators and that study is pointing to a mild to moderate recession in the offing.

Survey of forecasters expecting recession is highest ever

Survey of forecasters expecting recession is highest ever

NDR economic timing model says mild-moderate recession is likely

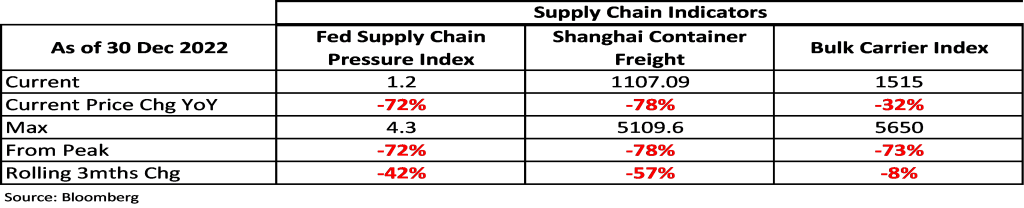
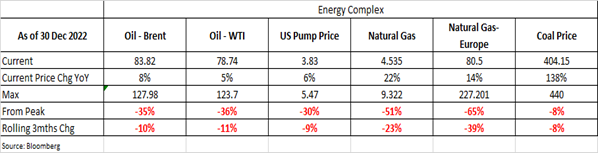
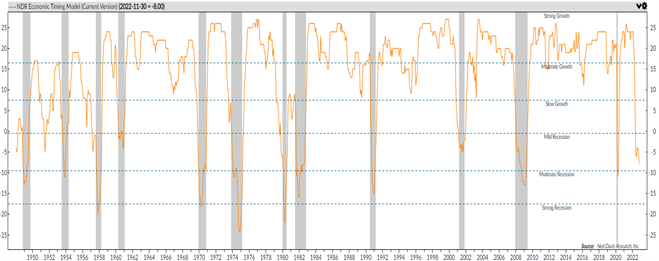
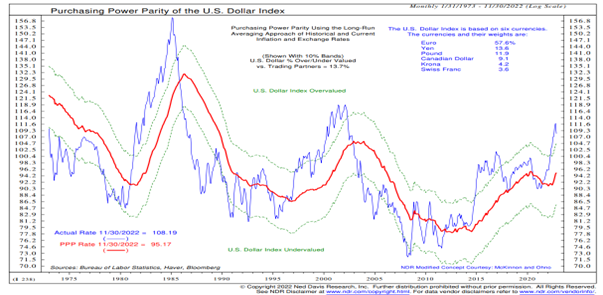
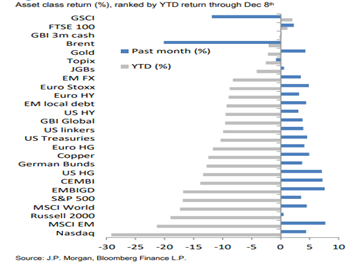
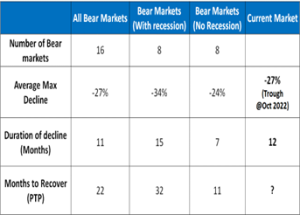
What kind of recession matters? If we enter a mild and even a moderate recession, much of the retrenchments for many asset classes are already done in 2022. However, if it morphs into a severe recession, there are still material drawdowns in nearly all equities indices. The high yield and emerging markets debts appear expensive and vulnerable to default risk, while there is moderate downside risk as credit spreads should widen further for investment-grade debt. Only Developed Markets Treasuries are cheap. Recent dollar weakness should also reverse, Gold might just have its occasional day in the sun, and oil should have further downside as demand weakens further.  

Fixed Income (Overweight in US Treasuries): Regardless of the shape of recession, Treasuries in several developed markets are preferred. Our analysis points to a peak of positive correlation between bonds and equities and suggests in the near term it will turn negative. This will revert government bonds to its role of a low-risk carry asset (3.5 to 4.0% yield) and as a portfolio diversifier. Our analysis, The Bear Necessities  provides a few important conclusions and markers:

  1. It shows that we are nearing the end of this current tightening cycle. Since 1957, the Fed has tightened a median of 366bps over a course of 12 months. Based on the latest Fed’s dots and the Treasury interest rate futures market, the peak of the Fed fund rate should be at 5% (a 500bps hiking cycle) by April-May 2023 (over 16-17 months) which translate to a longer and more aggressive tightening than past episodes. The narrative is similar for other central banks with monetary policy actions moving at a slower pace or towards the end but with higher terminal rates.
  2. Our analysis also suggests that the US10 yield peaks 78% of the time with a 1-3 months lead to the last Fed hike and the US10 yield generally peaks 70bps below the Fed Fund rate at the last hike. By the end of the hiking cycle, US10 yield generally trades 120 bps lower than the Fed Fund.

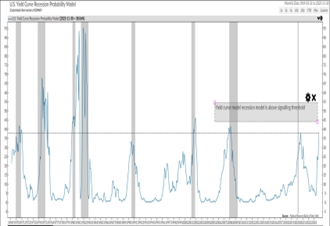
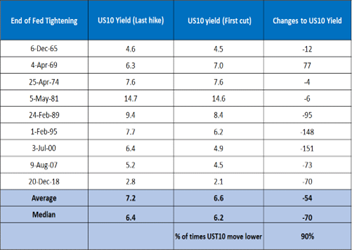
    History says US10 yield peak ahead and lower than terminal Fed Fund Rate


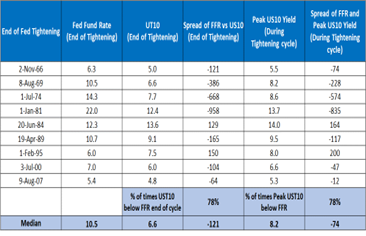
    Source: Bloomberg, Fed, NDR

  3. While the Fed typically holds its rate for 8 months before making the first cut,
  4. During this period, the US10 yield falls 90% of the time and trades 70bps lower at the end of the last hike.
  5. Combining (2) and (4), provides us a fair value range of where US10 yield should trade in 2023. Should Fed Fund rate end at 5%, US10 yield should trade 120 to 190 bps lower than the terminal rate of 5% or between 3.10% to 3.80% versus currently at 3.85%. However, unlike much of last year where we prefer long-dated Treasuries, we believe the yield curve will bull steepen favouring short-term Treasuries and we will also look to exit our inflation-linkers in the coming months.

Fed typically holds rates for 8 months but US10 yield trades lower between last hike and first rate cut

Besides Treasuries, we are overweight investment grade debt as yield is attractive relative to the risk. At 5.80% yield on BBB US Corporates, this is the highest level of yield since 2008 and 140bps higher than the peak of covid 2020. On a yield per duration risk taken, it is at the most attractive level since 2008. We are mindful in our credit selection preferring to buy high quality bonds and will lean on our collaboration with Principal Asset Management in credit assessment. Timing is also important as we prefer to increase our exposures when credit spread is at recessionary level. We continue to avoid high yield debt, leveraged loans, and most of emerging market debts. We are most concerned about private credit as we believe investors have not done sufficient due diligence and been lax in demanding stronger covenants.

Equities: We have been underweight Equities since October 2021, but we think the conditions to alter this view may presents itself by February-April. Some of the conditions we are looking are as follows:

  1. Since 1968, the SPX bear market that is associated with a recession normally lasts 15 months with a maximum decline of -34%. The market peaked in Jan 2022 and was -27% at its lowest in Oct 2022. Taking cue from this sample, the bear market could find new lows but could also end by May 2023.
  2. If we have a soft-landing scenario, SPX bottomed 1 month ahead of last Fed rate hike. This puts a possible market bottom in March-April 2023 as we are expecting Fed to end its hiking cycle in April-May.

    History tells us SPX could bottom sometime in Mar-May 2023

  3. We have said on numerous occasion the consensus estimates are way too high. Typically, in a recession, forward estimates of SPX are revised downward by -13%ppt from its peak and the downgrade cycle usually will last 15 months long. We are finally seeing analysts downgrading 2023 estimate which is now 4% off the peak and the downgrade commenced back in August 2022. We also know that SPX bottomed 9 months ahead of forward estimates bottoming. The biggest delta of decline during this process is in the first 6months of the downgrade and the least occurs in last 3 months of the downgrade cycle. Putting all these observations together, we can conclude with the following:
    • The biggest drawdown should have already happened in 3Q-4Q22.
    • The earnings forecast downgrade cycle should end in November 2023.
    • As such, the market could bottom between Mar-April 2023.


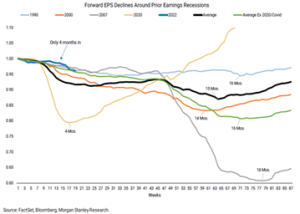
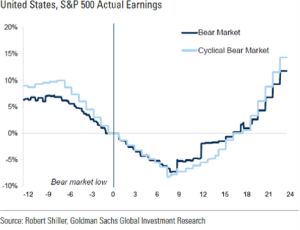
    Earnings forecast needs to fall further but market bottoms 6-9 months ahead of earnings bottom


The biggest caveat to all the above analyses for equities it that we do not enter a severe recession. We will be discussing about this in our next Navigator. For now, we are assuming it is a mild-moderate recession. While it is important to have a view, we must be modest in acknowledging there are still many unknowns in the market.

Alternatives: Our low/non-correlated strategies are now 25% of the portfolio spanning across credit, volatility arbitrage, CTAs, and long-short equities managers. They have performed well this year and we have plans to add more long/short equities managers and a non-correlated strategy in litigation financing in the coming quarters. Even as we believe in the near-term correlations between traditional asset classes of bonds and equities will moderate, having these low-correlated strategies improve our Sharpe ratio.

FX: We think the US dollar dominance takes a breather for this year. A multitude of factors from a swifter tightening policy by the Fed relative to other majors, flight to safety as a result of Russia war on Ukraine, and a differentiated economic prospects between the US and Europe, Japan and China has lead to an overvaluation of the USD. However, with Japan and China re-opening, Europe navigating its energy shortage better than expected, and the Fed near the end of its tightening bias but ECB has just commenced its cycle and BOJ likely pivot in 1Q23, these positive factors supporting the USD should unwind.

USD dollar is now the most expensive it has been the 1980s.

Commodities: Turning bullish on oil even as recession looms. While our investment clock suggest we should not own any commodities as we are already in the recession/stagflation quadrant, the near and intermediate term supply risk in oil lead us to alter our view. Although we have been contrarian bearish when oil price spike past $120 in the early days of Ukraine war and has kept away from investing in it throughout the year primarily because we have bearish view of the global economy as well as the remarkable continuous shipment of Russian oil, we think oil price could trend higher from here. While we have recession as our base case assumption, we note that there has been a severe under-investment in oil & gas complexes since peaking in the last oil boom of 2014. Spare capacity is also very limited within the OPEC grouping and inventory draws have been large such that stocks are now at precarious low level.

Long periods of underinvestment in oil & gas

Spare capacity in OPEC is limited

Positioning is light now in oil as well as time spreads offer little incentive for oil traders to take oil on a longer-term contract. When we track the leading oil ETF, it has seen its total fund assets fell from a high of $3.7bn in April 2022 to less than $2bn by the end of the year resulting to net outflow of $394mn in 2022.

Oil stockpile is low as well, prone to demand risk  

Oil ETF saw a reversal of surge inflow to outflow

Cash: Cash holdings have been reduced and deployed to increase our holding in investment-grade debt and reduce our severely underweight equities.

Featured Picture/Quote:

Nah not this Goat, the others.

Edward Lim, CFA

Chief Investment Officer
edwardlim@covenant-capital.com

Risk Disclosure

Investors should consider this report as only a single factor in making their investment decision. Covenant Capital (“CC”) may not have taken any steps to ensure that the securities or financial instruments referred to in this report are suitable for any particular investor. CC will not treat recipients as its customers by their receiving the report. The investments or services contained or referred to in this report may not be suitable for you and it is recommended that you consult an independent investment advisor if you are in doubt about such investments or investment services. Nothing in this report constitutes investment, legal, accounting, or tax advice or a representation that any investment or strategy is suitable or appropriate to your circumstances or otherwise constitutes a personal recommendation to you. The price, value of, and income from any of the securities or financial instruments mentioned in this report can fall as well as rise. The value of securities and financial instruments is affected by changes in a spot or forward interest and exchange rates, economic indicators, the financial standing of any issuer or reference issuer, etc., that may have a positive or adverse effect on the income from or the price of such securities or financial instruments. By purchasing securities or financial instruments, you may incur above the principal as a result of fluctuations in market prices or other financial indices, etc. Investors in securities such as ADRs, the values of which are influenced by currency volatility, effectively assume this risk.

Back to Perspectives

Personal Data Protection Act

As per the PDPA, the below information maps out how Covenant Capital Pte Ltd. collects, uses, discloses, and protects the personal data you have provided to us.

What types of Personal Data do Covenant Capital collect?

Personal data is any information that relates to an identifiable individual and we may collect this information when you interact with our staffs:

1. Personal Particulars (e.g. name, address, date of birth)

2. Tax, Insurance and employment details

3. Banking information and financial details

4. Details of interactions with us (eg. Images, voice recordings, personal opinions)

5. Information obtained from mobile devices with your consent

How do we collect your Personal Data?

The below are the ways that we collect your data:

1. Investment Management Agreement forms, Risk Profile forms, Subscription forms

2. Via emails, SMSes, Whatsapps, phone calls or any other digital means to the office or its’ staffs

3. Photos and videos of you from our events; and

4. Information about your use of our services and website, including cookies and IP address

How do we use your Personal Data?

1. For General Support

a. Verify your identity before providing our services, or responding to any of your queries, feed-back and complaints

2. For our Internal Operations

a. Aid our analysis so that we can improve our services and products
b. Manage the company’s day-to-day business operations
c. Ensure that the information that we have on you is current and up to date
d. Conducting Due Diligence checks to reduce Money Laundering and Terrorist Financing Schemes

3. Financing Schemes

e. Comply with all laws and obligations from any legal authorities
f. Seek professional advice, including legal
g. Provide updates to you

Who do we share your Personal Data with?

1. Any officer or employee of the company and its related companies;

2. Third parties that works with us, such as Custodian Bank of choice, Fund Administrators for the Funds that we manage, any third party Fund’s Administrators, IT support who back up our database and other service provider

3. Relevant authorities such as government or regulatory authorities, statutory bodies, law enforcement agencies

4. Your authorized representatives and any other third-party whom you authorize the company to disclose your personal data to;

5. We require all personnel of the company and third party to ensure that any of your data disclosed to them is kept confidential and secure

6. We do not sell your Personal Data to any third party, and we shall comply fully with any duty and obligation of confidentiality that governs our relationship with you

When the company discloses your personal data to third-parties, the company will, to the best of its abilities, exercise reasonable due diligence that they are contractually bound to protect your personal data in accordance with applicable laws and regulations, save in cases where by your personal data is publicly available.

Accessing and Correction Request and Withdrawal of Consent

Please contact your advisor/banker or alternatively you can contact ccops@covenant-capital.com should you have the following queries.

1. Regarding the company’s data protection policies and processes

2. Request access to and/or make corrections to your personal data in the company’s possession; or

3. Wish to withdraw your consent to our collection, use or disclosure of your personal data.

The company endeavours to respond to you within 30 days of the submission.

Should you choose to withdraw your consent to any or all use of your personal data, the company might not be able to continue to provide any further services or maintain further relationships. Such withdrawal may also result in the termination of any agreement or relationship that you have with us.

Complaints

If you wish to make a complaint with regards to the handling and treatment of your personal data, please contact the company’s Data Protection Officer, mentioned below, directly. The DPO shall contact you within 5 working days to provide you with an estimated timeframe for the investigation and resolution of your complaint. Should the outcome of the resolution is not satisfactory, you may refer to the Personal Data Protection Commission (PDPC) for any further resolutions.

If you have any doubt, please contact Mr Tay Kian Ngiap, the PDPA Data Protection Officer for Covenant Capital Pte. Ltd. He can be reached at kntay@covenant-capital.com

Terms of Use

By accessing this website, you hereby agree to the terms listed on the website, all applicable laws and regulations, and agree that you are responsible for compliance with any applicable local laws. Any claim relating to Covenant Capital’s website shall be governed by the laws of the Republic of Singapore without regard to its conflict of law provisions.

1. License to Use

Permission is granted to download information and materials on Covenant Capital’s website for personal, non-commercial viewing only. This is the grant of a license, not a transfer of title, and under this license you may not:

i) modify or copy the information and materials;
ii) use the information and materials for any commercial purpose, or for any public display (commercial or non- commercial);
iii) attempt to decompile or reverse engineer any software contained on Covenant Capital’s web site;
iv) remove any copyright or other proprietary notations from the materials; or
v) transfer the materials to another person or “mirror” the materials on any other server.

All content, including but not limited to logo, tagline, graphics, images, text contents, buttons, icons, design and structure are property of Covenant Capital. All content on this website is protected by copyright, patent and trademark laws.
The Covenant Capital logo should not be used for any purpose whatsoever beyond what is available on the website, unless you have obtained written approval from us.

2. Disclaimer

The materials on Covenant Capital’s website are provided “as is”. Covenant Capital makes no warranties, expressed or implied, and hereby disclaims and negates all other warranties, including without limitation, implied warranties or conditions of merchantability, fitness for a particular purpose, or non-infringement of intellectual property or other violation of rights. Further, Covenant Capital does not warrant or make any representations concerning the accuracy, likely results, or reliability of the use of the materials on its Internet web site or otherwise relating to such materials or on any sites linked to this site.
It is your responsibility to evaluate the accuracy, completeness, or usefulness of any information, advice and other content available through this website.
You should not solely rely on the information, advice and other contents available on our website for decisions on investment(s) or decision with respect to our company’s products and services. You are advised to seek additional information required for you to make sound, well-informed and reasonable decision.

3. Limitations

In no event shall Covenant Capital or its suppliers be liable for any damages (including, without limitation, damages for loss of data or profit, or due to business interruption,) arising out of the use, inability to use or user’s reliance on the materials obtained through Covenant Capital’s web site, even if Covenant Capital or a Covenant Capital authorized representative has been notified orally or in writing of the possibility of such damage.

4. No Offer

Nothing in this website constitutes a solicitation, an offer, or a recommendation to buy or sell any investment instruments, to effect any transactions, or to conclude any legal act of any kind whatsoever. The information on this web site is subject to change (including, without limitation, modification, deletion or replacement thereof) without prior notice. When making decision on investments, you are advised to seek additional information required for you to make sound, well-informed and reasonable decision.

5. Revisions and Errata

The materials appearing on Covenant Capital’s website may include technical, typographical, or photographic errors. Covenant Capital does not warrant that any of the materials on its website are accurate, complete, or current. Covenant Capital may make changes to the materials contained on its website at any time without notice. Covenant Capital does not, however, make any commitment to update the materials.

6. Site Terms of Use Modifications

Covenant Capital may revise these terms of use for its web site at any time without notice. By using this website you are agreeing to be bound by the then current version of these Terms and Conditions of Use. If any of the term or change is deemed not acceptable to you, you should not continue to browse this site.

Privacy Statement

Your privacy is very important to us and we respect your online privacy. This Policy has been developed in order for you to understand how we collect, use, communicate and disclose and make use of personal information. We are committed to conducting our business in accordance with these principles in order to ensure that the confidentiality of personal information is protected and maintained.

1. Collection and Use of Information

We may collect personal identifiable information, such as names, postal addresses, email addresses, etc., when voluntarily submitted by visitors to our website. This information is only used to fulfill your specific request, unless further permission is provided to us to use it in any other manner or for any other purpose.

2. Web Cookies / Tracking Technology

A cookie is a small file which seeks permission to be placed on your computer’s hard drive. Once you are agreeable to the use of cookies, the file is added and the cookie helps analyse web traffic and tracks visits to a particular website. Cookies allow web applications to respond to you as an individual. The web application can tailor its operations to your needs, likes and dislikes by gathering and remembering information about your preferences.

We use traffic log cookies to identify which pages are being used. This helps us analyse data about website traffic and improve our website in order to tailor it to customer needs. We only use this information for statistical analysis purposes and then the data is removed from the system.

Overall, cookies help us provide you with a better website by enabling us to monitor which pages you find useful and which you do not. A cookie in no way gives us access to your computer or any information about you, other than the data you choose to share with us.

You can choose to accept or decline cookies. Most web browsers automatically accept cookies, but you can usually modify your browser setting to decline cookies if you prefer. This may prevent you from taking full advantage of the website.

3. Links to other websites

Our website may contain links to other websites of interest. However, once you have used these links to leave our site, you should note that we do not have any control over that other website. Therefore, we cannot be responsible for the protection and privacy of any information that you provide whilst visiting such sites, and this privacy statement does not govern such sites. You should exercise caution and review the privacy statement applicable to that particular website.

4. Distribution of Information

We will not sell, distribute or lease your personal information to third parties unless we have your permission or are required by law to do so. We may use your personal information to send you promotional information about third parties’ products or services, which we think you may find interesting if you tell us that you wish this to happen.

If you believe that any information we are holding on you is incorrect or incomplete, please write to or email us as soon as possible at the above address. We will promptly correct any information found to be incorrect.

When required by law, we may share information with governmental agencies or other companies assisting in the investigations. The information is not provided to these companies for marketing purposes.

5. Commitment to Data Security

To make sure your personal information is secured, we communicate our privacy and security guidelines to all Covenant Capital’s employees and strictly enforce privacy safeguards within the company.

Your personal identifiable information is kept secure. Only authorised employees, agents and contractors who have a direct need to access the information will be able to view this information.

We reserve the right to make changes to this policy. Any changes to this policy will be posted.

Disclaimer

By entering this site you agree to be bound by the Terms and Conditions of Use. COVENANT CAPITAL PTE LTD (“CCPL”) is a Capital Markets License (AI/II) holder and regulated by the Monetary Authority of Singapore (‘MAS’).

Accredited & Institutional Investors

By using this site you represent and warrant that you are an accredited investor or institutional investor as defined in the Singapore Securities and Futures Act (Chapter 289). In using this site users represent that they are an accredited and/or Institutional investor and use this site for their own information purposes only.