


Edward Lim, CFA

The US aircraft carrier is not just the best embodiment of US military supremacy but also its unassailable ability to shape global politics. We saw that might at work when US moved not just one but two aircraft carrier strike groups into the Middle East region at the onset of the current Israel-Palestine conflict. In no small part, Iran has kept of out of the fray because of the ominous presence of this military asset. It is precisely its omnipotence both militarily and geopolitically that makes it a prime target for many of its enemies to attack it. But how difficult is it to sink a US aircraft carrier? The unequivocal answer is “pretty hard”. There are several reasons that underpin its invincibility. First, it is difficult to locate it. As it is nuclear-powered, its ability to stay in the operating arena is only constrained by its need to refuel consumables enabling it to stay out in the sea for 90 days. It is also fast! The aircraft carrier can achieve a speed of up to 35 miles per hour. In other words, within 90mins it has been spotted, that aircraft carrier area would have travelled anywhere in 6000 square miles or almost the entire land mass of the state of Washington.
After the enemy has located it, the next task is to continuously track the carrier. To track it precisely one would require an assortment of land, sea, air, and space-based telemetry. No country currently possesses the capability to track and activate command decisions to launch an array of weapons against it, not even the US. And that is assuming the strike group has not already engaged their countermeasures such as jamming, deception, and early strikes on the enemy’s capabilities. This leads to the third reason. An aircraft carrier does not travel alone. The strike group entails air, sea, underwater, and satellite capabilities that are all coordinated into a single network-centric command center for the commander to analyze and initiate offensive and defensive manoeuvres. It typically will have airborne surveillance through its satellites, Hawkeye aircraft, and Aegis radars of the accompanying ships and an air wing of at least 40 attack airplanes like the F18 and Seahawk helicopters. Its sea capabilities include at least one to two mine sweepers, missile cruisers, anticraft destroyers, and submarines that can launch conventional and nuclear warheads. To wrap up its offensive and defensive capabilities, each warship is equipped with a plethora of missiles and gunships to protect itself. However, if by some providence the enemy managed to escape the strike group’s countermeasures and forward projection shield and land some missiles or torpedoes directly on the aircraft carrier, it would still take a lot of bombardments to sink the carrier. It might cause some operational issues but to sink it would be nearly impossible because of the way the carrier is built. It uses a combination of reinforced steel hull, watertight compartments, damage control systems, and a crew with decades of experience to implement redundant systems to ensure it continues to operate even if it suffered several direct hits. Don’t take my word for it, watch this video, US Navy sinks its aircraft carrier.
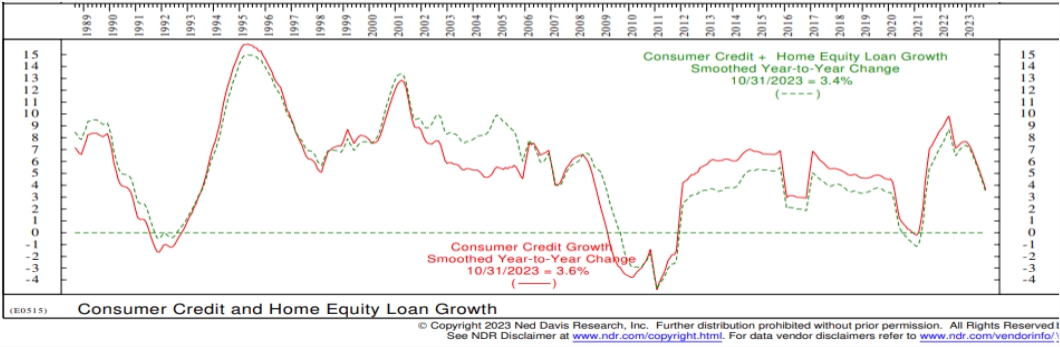
What does the formidable might of a US aircraft carrier strike group have to do with macroeconomics? Throughout the 2023, consensus was expecting the US to enter a recession, including us. The market was expecting the US to enter a recession by 1Q23 (we had in late 2Q-3Q23 albeit a mild one), subsequently postponed that to 3Q23 and some are still expecting a recession to occur in early 2024. The premonition of pending recession is not without cause. The Fed has begun its most aggressive hike since the 1980s prompting the US10 yield to rise from 3.8% at the start of the year to a year high of 5%. That dragged the 30-year mortgage and automobile financing rates to their 22-year highs of 8% and 6.7% respectively. The high borrowing cost has also restrained consumer demand for loans which has since slowed to a pace of 3.4% by the end of 2023 and the latest survey from loan officers indicates demand for consumer loans remains muted.
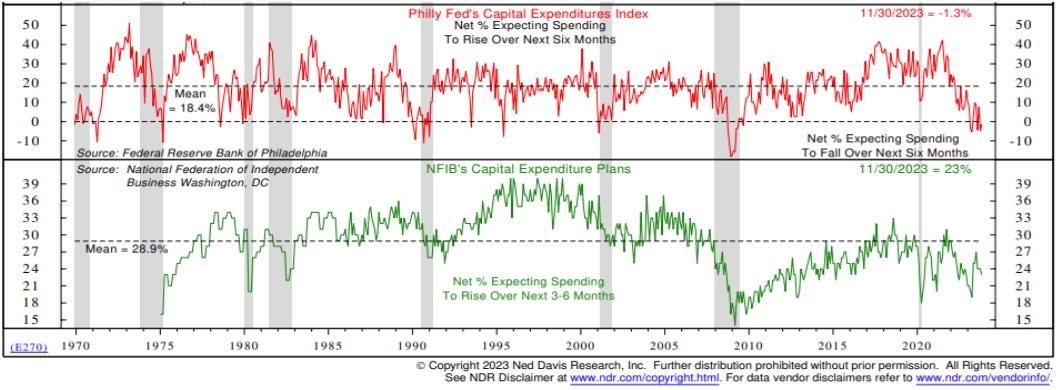
High-interest rates have also curtailed companies to increase capex. Capex surveys peaked back in 2022 and have continued to slide with one survey, Phill Fed’s Capex Index, showing 0% of correspondents expecting any increase in capex in the next 6 months.
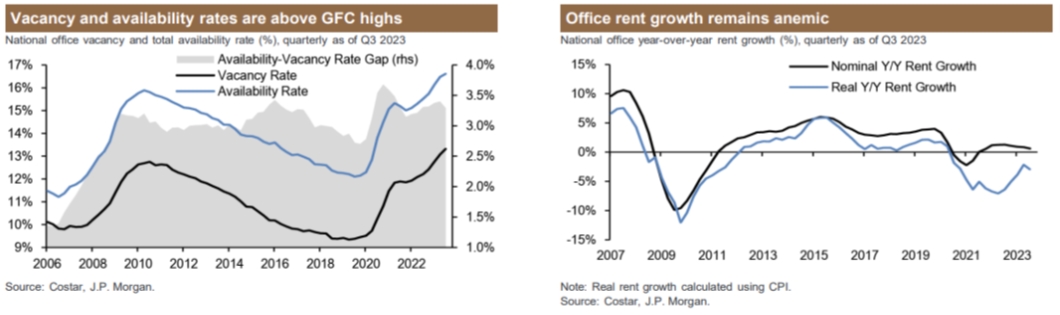
Aside from taking on the barrage of the expected negative consequences of a monetary tightening regime, the US economy had to contend with the bankruptcies of five banks in the form of the infamous trio of First Republic, Silicon Valley, and Signature Bank and less well-televised ones such as Heartland Tri-State, Kansas (closed in July 2023) and Citizens Banks, Iowa (closed in November). We have already warned about the risk of global real estate as early as 2019. In the aftermath of the banks bankruptcies, we also learned that these smaller regional banks have been a disproportionate lender to the US commercial real estate, Everything, everywhere, all at once. Commercial real estate in the US is a large asset class worth $2trn. The segment has seen the vacancy rate rising post-Covid due to changes in work culture and preferences for better ESG-aligned buildings. Vacancy rates are now higher than in the depths of the 2008 GFC compounded by the higher level of stock availability. Post covid, the growth in office rent has been near zero and when you cobbled that with a rising capitalization rate, the asset value has declined by 15%-20% on average in 2023, and some forecasts are expecting another 10-15% decline for 2024.
And if that is not enough to make one dead sure that a recession is unavoidable, throw in the deadly concoction of two major wars, continuous trade spat with China, and oil price that has an average $12 pbl higher in 2023 than the average between 2019-2022. However, the US economy remains not just infallible but is expected to chalk one of the highest GDP growth rates in a decade outside of Covid rebound in 2021. At the start of the year, consensus had US GDP eking out a mere 0.5% growth but as the year progressed, this forecast was revised upwards frequently and is expected to grow 2.4% by year end, a good 90 bps higher than its long-term potential. For 2024, consensus is expecting GDP growth to slow back to trend at 1.3% though revision for 2024 has been positive since August.
Most of our readers would have known that we employed a four-prong approach to assess recession risk as well as growth momentum. The method includes looking at Nowcasting and Forecasting models, market signals like yield curve, and NDR’s economy timing model. Throughout 2023, we have three if not all four approaches pointing to an elevated risk of recession within the next 12 months with varying degrees from a mild to moderately severe recession. Even when using the weight of evidence approach, we have been wrong. Hence, the question is to understand why this economic cycle has defied conventional wisdom and critically, will the drivers supporting this upside surprise in 2023 continue into 2024 and beyond?
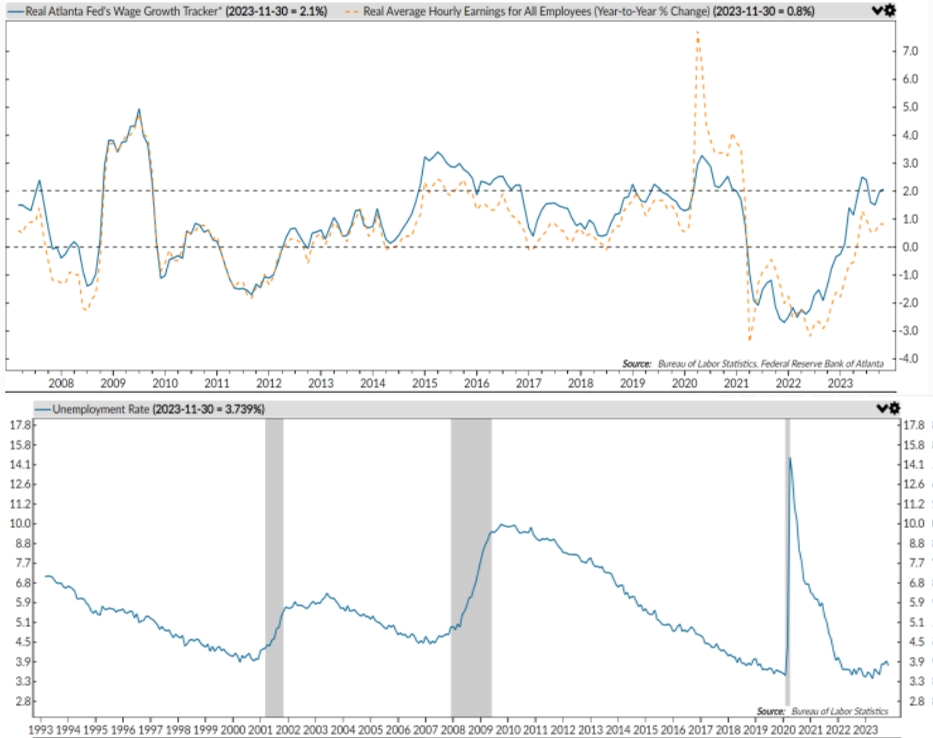
One of the most spectacular features of this expansion is the strength of the US consumer. The combination of positive real wage growth (i.e. nominal wage growth minus inflation), low unemployment rate, healthy saving rates, and strong balance sheet accumulated through gains in the stock market and residential real estate since 2019, has enabled the US consumer to continue spending. Even as we are witnessing a trade-down in consumer spending in recent months, the latest aggregate retail sales in the US registered a respectable growth of 3.4% yoy in November for a cumulative 1.3% increase year-to-date; not quite a recessionary level.
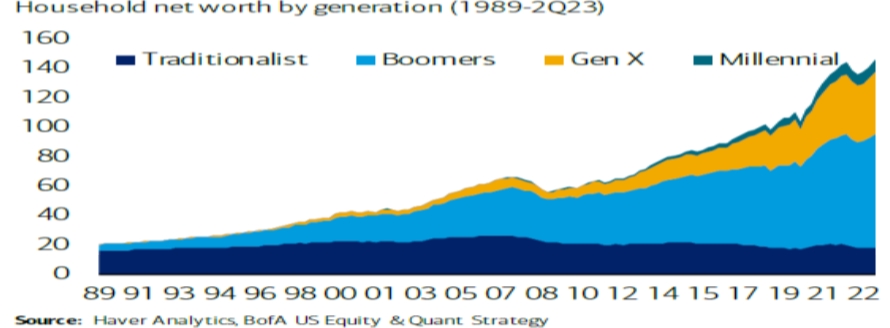
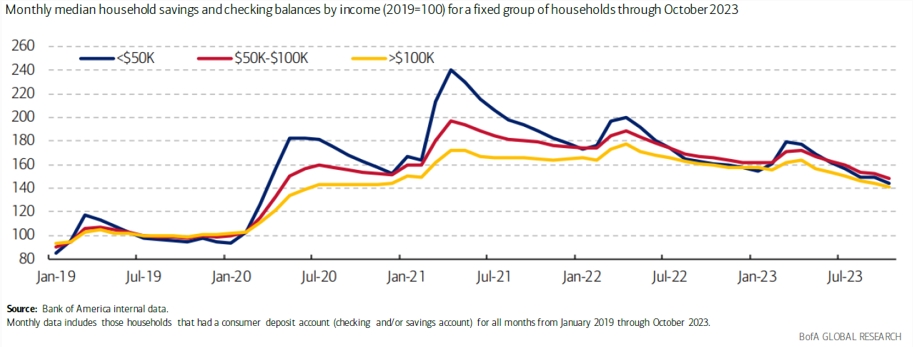
The strength of the US consumer balance sheet is best expressed in these two charts. The first chart shows US household net worth has swelled to $145 trn equivalent to 540% of its GDP. The median household bank balances have increased by 40 to 50% since the start of 2019 even for the lower bracket.
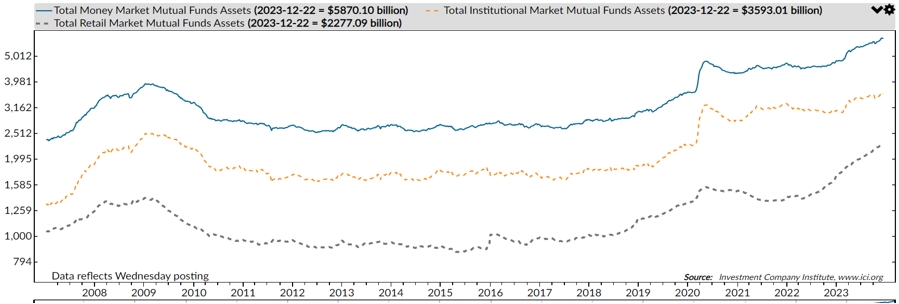
Not only have the average US consumers become wealthier and with larger bank balances, but they are also holding one of the largest amounts in money-market funds on record that could potentially be spent or redeployed into other asset classes.
The second reason for the upside surprise to the US economy is an expansionary fiscal policy that has counter-balanced a restrictive monetary policy. A potent combination of student debt relief, the Infrastructure, CHIPs, and IRA Acts have buffered the economy from the 525bp Fed Fund rate hike. In total these four programs provided a fillip of 7.4% of deficit spending totaling approximately $80bn of extra spending in 2023.
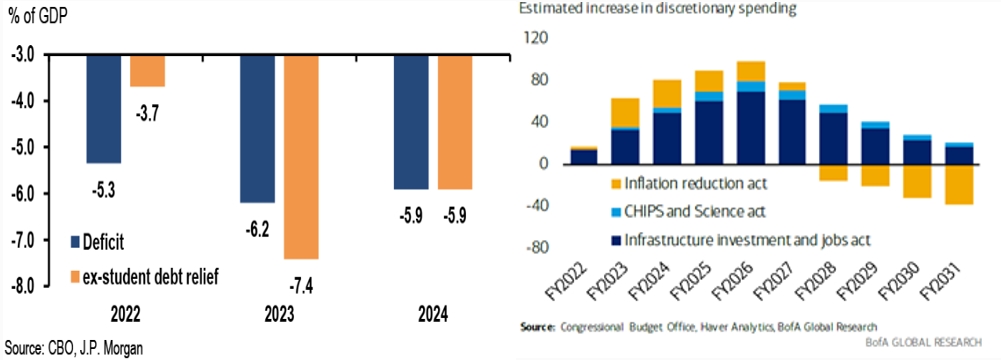
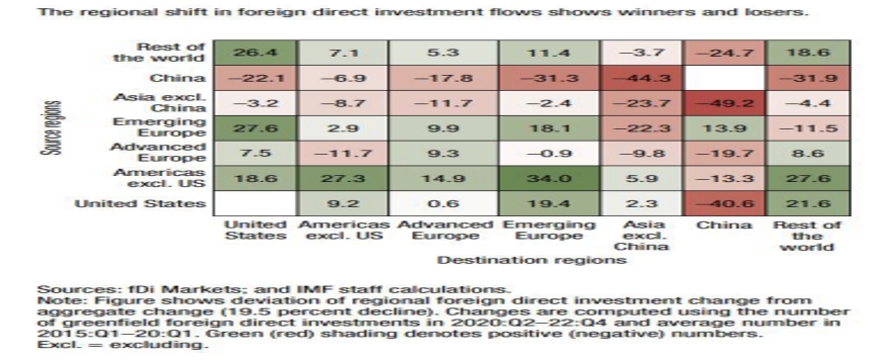
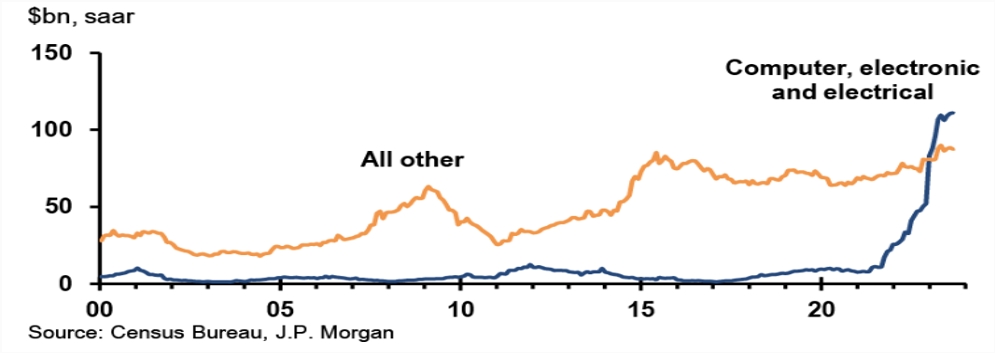
The other attendant bolster to the US growth surprise is the effect of friend-shoring in the aftermath of Covid. US has been the biggest beneficiary of this trend of sourcing more from the US while China has suffered the most. The table below illustrates the changes in the trend in Foreign Direct Investments across different regions. The US has seen marked increases from Emerging Europe, Rest of the Worlds, Americas excluding the US, investing more in the US as a source region. Private investments in computers, electronics and electrical manufacturing assets have skyrocketed to above $100bn in the last 2 years; a magnitude we have not seen in many decades. While such a rise is unsustainable in the long run, we expect it will remain elevated in the next 2 years given the multi-year rollout of the Infrastructure, CHIPs and IRA acts (see chart above).
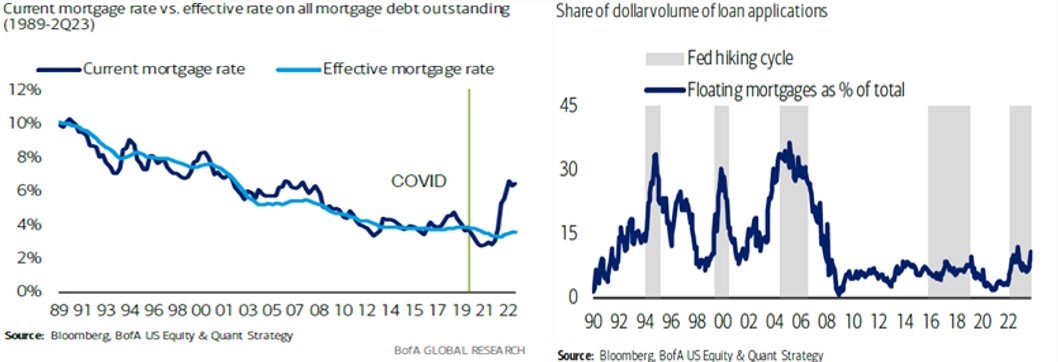
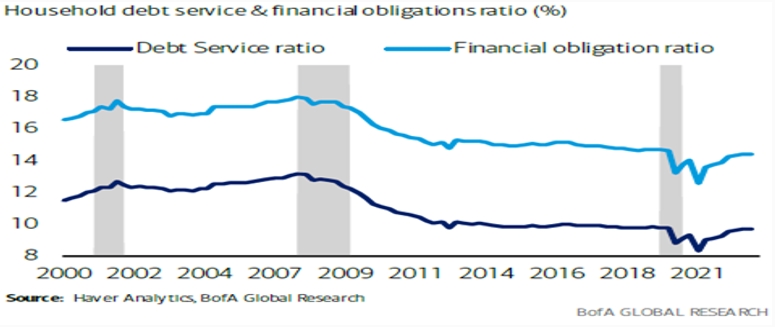
One of our key premises that a US recession is unavoidable is the assumption that with higher policy and interest rates, consumers and corporates will see significant pressure from higher interest expenses, will lower their propensity to spend, and corporate profitability will decline However, that has not panned out. On the consumer side, the effective mortgage rate has risen by only 100bps because much of their mortgage loans have been refinanced in 2021 and the earlier part of 2022. Furthermore, floating rates mortgages form a much smaller portion of total mortgage outstanding now versus back in the pre-GFC subprime crisis or even prior to 2000 dot-com bust. Unlike many other countries, US mortgages are usually on 30-year loan and not so insane financing schemes in places like Singapore where you can only fix your loan rate for only three years. Through a combination of term-out loans and the rising wealth effect from property and the stock markets, the overall financial obligation and debt servicing capability of US household remain robust.
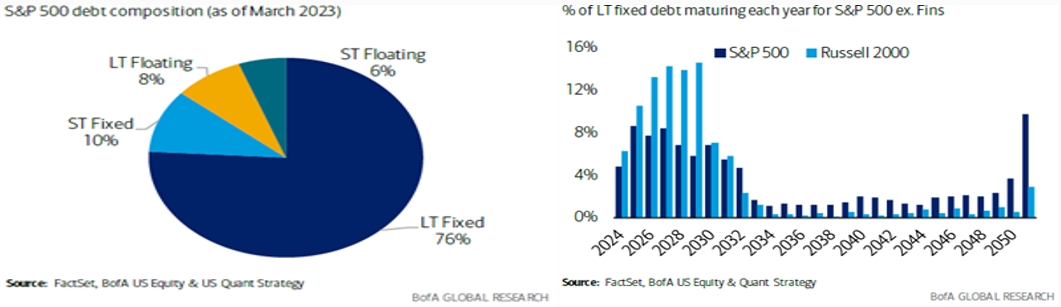
Aside from the troubles in the real estate sector, the rest of the corporates have also managed the impact of rising interest rates better than we expected. 76% of US corporates’ debt is long-term and fixed rate and much of that is termed out to 2026-2029.
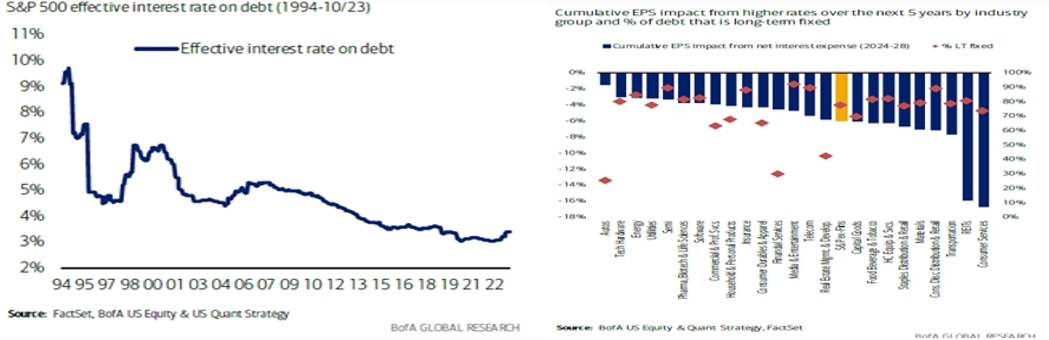
Their effective interest rate has risen but not by a lot and the estimated cumulative impact to EPS over the next 5 years holding current rates here will only detract less than 5% of earnings for S&P500 in the same period.
On balance, our four-prong approach to ascertain growth momentum and recession risk shows that growth is expected to step down from the blistering pace of 3Q23 for the US, but signs of improvement in emerging economies will support a slower growth narrative and not an impending recession.
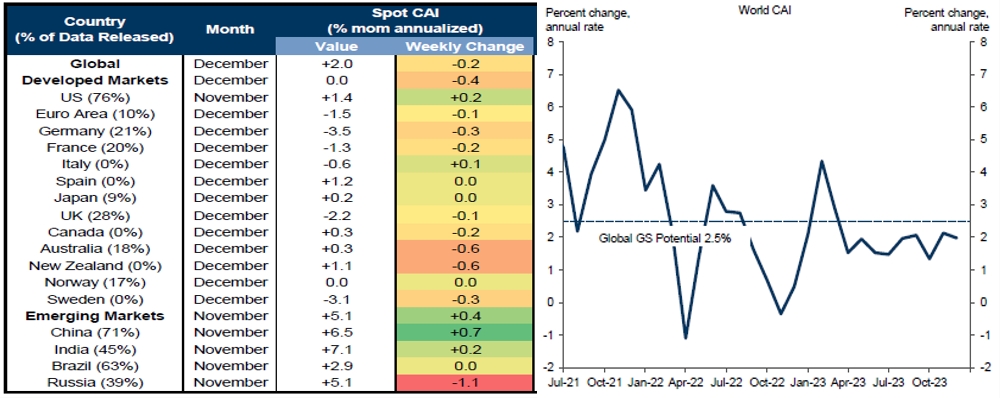
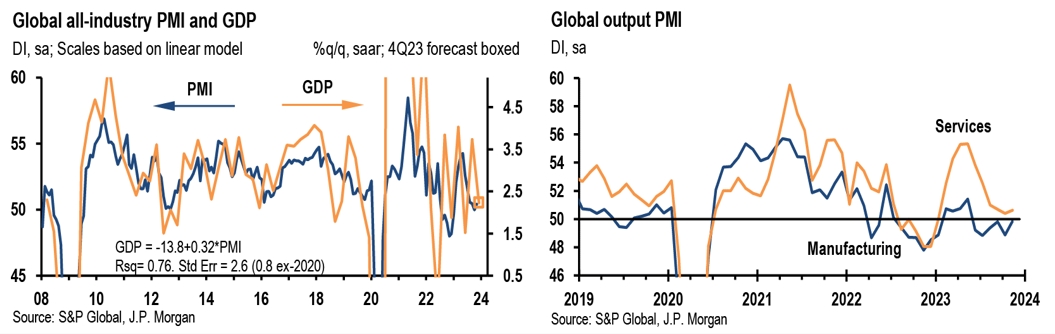
Using the Goldman Sachs Nowcaster model, global growth is clipping at 2% pace currently, off its long-term potential of 2.5%. The continued weakness in Euro area, particularly in Germany and UK (both are expected to be in recession) is offset by an improving US that is growing near its long-term potential, positive momentum continuing in India, and China turning the corner.
Using JP Morgan PMI indicators, the forward model indicates a global economy that is tracking close to its trend-like pace at 2.3%. Critically, the PMI indicators for manufacturing (49.9) are at the cusp of turning expansionary after sliding into contractionary for much of 2023. Both output and new orders for manufacturing are turning around and prices for their manufactured products are firming. Two of the three manufacturing surveys covering consumer, investment, and intermediate goods are in the expansionary zone (Consumer Goods 50.7 and Investment Goods 50.7), the first time since May where we have at least two of three sub-segments of this series in expansionary territory. If this improving trend of manufacturing continues into expansionary zone in the coming months, it will be the first time since May both engines of global growth, services and manufacturing, are firing together.
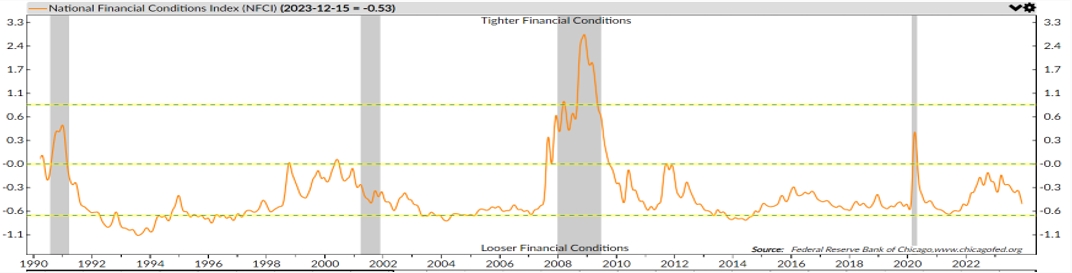
Conclusions from market indicators are less obvious. While the yield curve remains inverted other indicators like the Financial Conditions Index have loosened and are not at the level that is typically associated with a recession. We have written extensively on why the history of the inverted yield curve as a harbinger of recession is not particularly dependable and argued contemporaneous issues like distortion by central banker’s past uber-easy policy and hedge fund community speculative positioning have rendered more noise in the inverted yield curve.
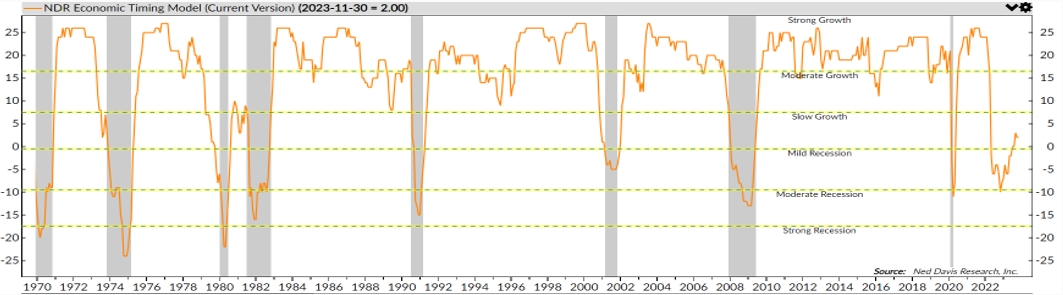
Lastly, using NDR Economic Timing Model, the global economy has transitioned out of “Mild” and “Moderate” recession phases that spanned from May-Aug to “Slow growth” phase since.
Asset Allocation Strategy
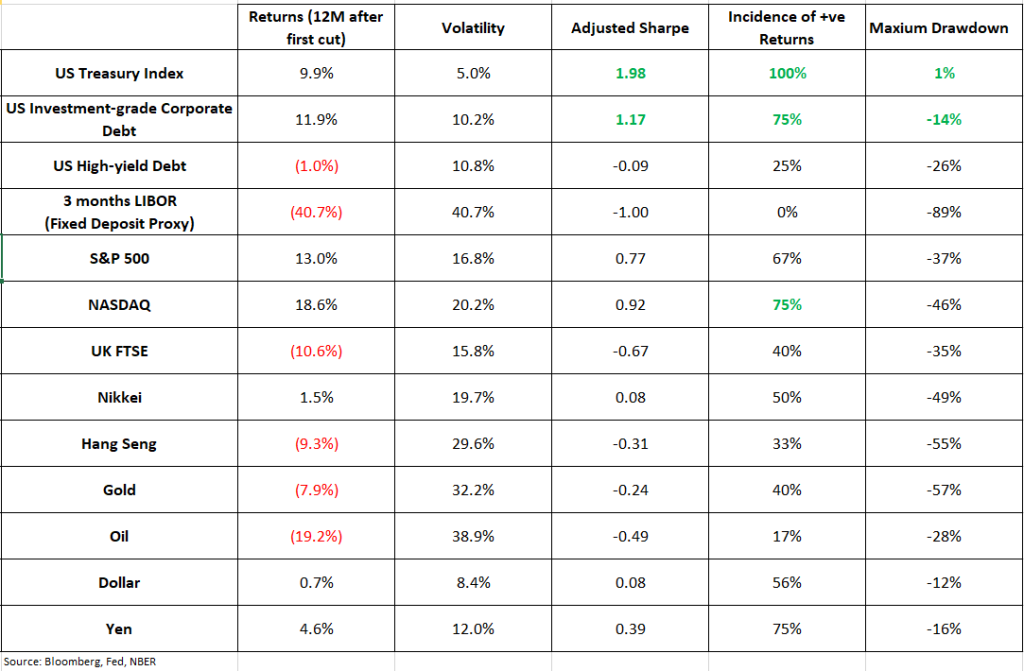
In the tables below, we analysed the performance of various asset classes 3months before the first rate cut and 12 months after. Given that the market is pricing the first Fed cut to be in March 2024, the empirical data detailing the 3 months prior to a Fed cut can provide us some guidance to the possible short-term performance paths.
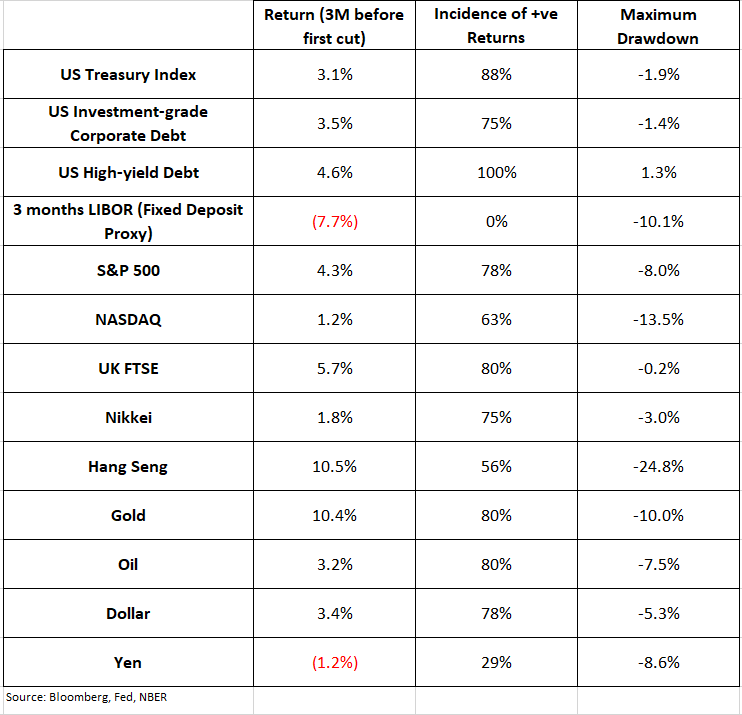
We note that all major asset classes are up three months prior to the first Fed cut except for our fixed deposit proxy and the Yen. It is interesting to note the performance between bonds and equities are not significantly different eg. US Investment-grade debt returned 3.5% just 80bps shy of S&P. The broader bond asset classes have a higher incidence of positive returns than the major equities indices, and the maximum drawdown for bonds is also far lower. Gold and oil tend to perform well but the dollar strengthen against the Yen. Our current asset allocation does mirror some of these findings with our preference to tilt our fixed income holdings in government securities and investment-grade debt and overweighting S&P relative to NASDAQ and the rest of the world. We are also looking for an opportunity to re-enter Gold but our stance on Gold is a much longer-term trade on the back of the risk of de-dollarization. Over the next 12 months, Treasuries and investment-grade debt performed the best on a risk adjusted basis, incidence of positive returns, and lower risk of drawdown. Even in a no recession scenario, this still holds true. Equities leadership rotates back to growth, but emerging markets fared poorly. Yen strengthens against the US Dollar, Gold is down, and oil performed really poorly. But the important point is the cash (aka Fixed Deposit) fared the worst in the sense the interest rate you receive is lower over this period.
Equities: Upgrading to Overweight from Underweight. Our long-standing view of underweight equities since Oct 2021 has served us well in 2022 but the idiosyncratic rip of the equity market in 2023 has taken us by surprise. It is not just the resilience of the US economy but the aftermath of the real and hyped-up spillover effects of generative AI since debuting to the public consciousness. Have a listen to our global equities manager views on this theme on Spotify, Generative A.I – My New Analyst. We are upgrading our equities to overweight given our sanguine view of the global economy as well as our expectation that deflation forces continue, leading to a Fed pivot by 2Q24. Nonetheless, there is great humility in our views and there is still a risk of consumption slow-down leading to a recession or resurgence of inflation. We think the risk of the latter is unlikely but will judge the risk of inflation staying stubbornly high against an exuberant pricing of rates as a probable risk.
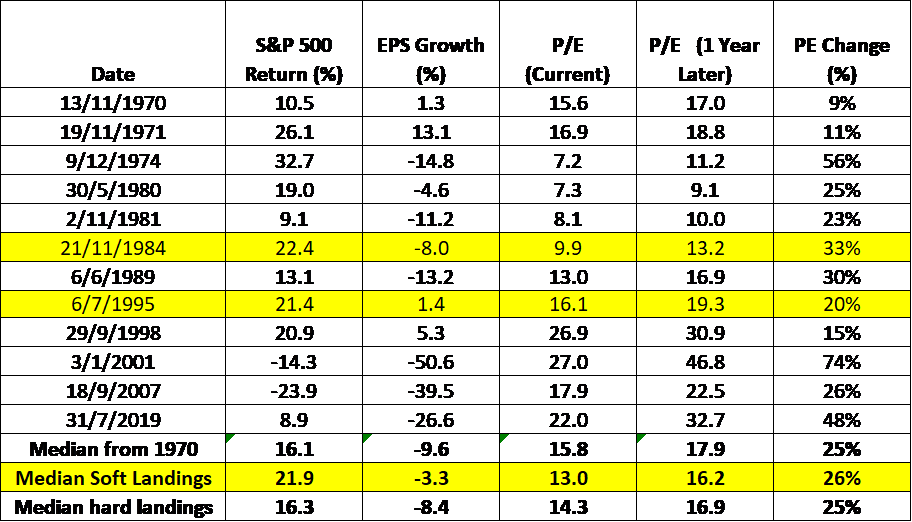
One of the key factors holding back by our upgrade throughout 2023 has been valuations but we have chimed in the last Navigator, High and Dry, and we are seeing pockets of opportunities. While the S&P500 currently trades at 19x and is above the 30-year forward PE average of 16x, if we consider the Magnificent 7 accounted for 72% of the SPX rise, the rest of the 493 stocks in the index have only risen 6% in 2023. Adjusting for the Magnificent 7, the valuation of S&P on an equally weighted basis is not demanding trading at its 30-year average of 14x. But the most important counter to the “valuation is not cheap” concern is that PE multiple always expands when the Fed initiates the first cut. (The market is currently expecting a series of 125bps cuts for 2024 starting in March. We are less aggressive expecting the first cut in 2Q24 and 100bps for the entire year). Since 1970, PE multiple expanded by 25% a year after the Fed first cut its policy rate. One could argue that the 25% expansion in multiple is predicated on the expectation of an aggressive Fed easing due to a recession. Hence, in a soft-landing scenario that we are espousing, the rate cuts will be smaller and therefore multiple expansion should be lesser. Yes indeed. Based on the limited soft-landing scenarios we have (1984 and 1995), the Fed cuts its policy rates 225bps less than in periods of recession, but PE multiple still increased by 26% into the next 12 months in this scenario.
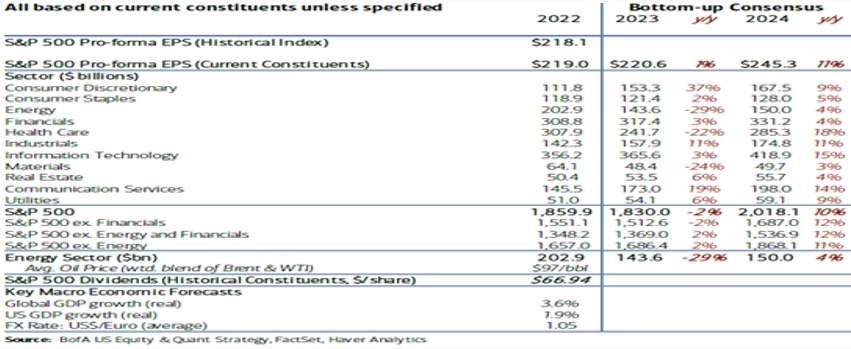
The second reason for our upgrade is we are expecting earnings to rebound but also to broaden beyond the communication services and consumer discretionary sectors. We have expected earnings to decline -5 to -10% in 2023 but the current trajectory points to a smaller decline of flat to -2%. Consensus is forecasting earnings to rebound rising 11% in 2024, though our own guess suggests a smaller increase of 5 to 7%. A crucial element of these forecasts is that all eleven sectors are expected to register positive year-on-year growth in contrast to 8 sectors posting positive EPS growth in 2023.
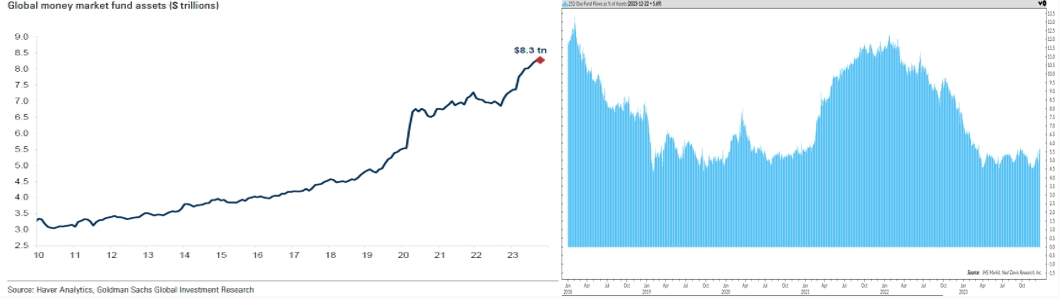
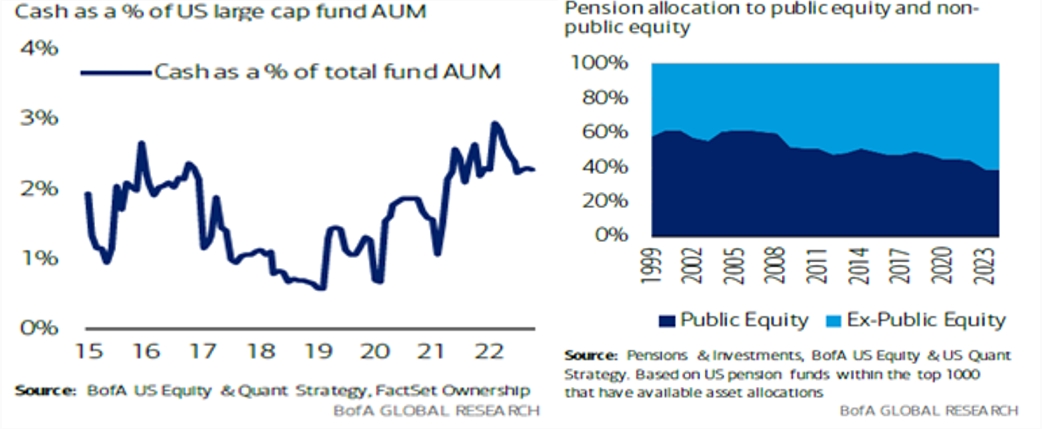
Lastly, the broadening of earnings prospects coupled with light positioning will draw money out of the system into riskier assets and equities will be the prime beneficiary. The total size of the global money market funds is at its all-time high at $8.3 trn (or 18% of S&P market capitalization). Equity ETFs have gave only seen a 5.7% increase in inflows in 2023.
Mutual funds holdings in cash are also near their multi-year high. Furthermore, we think pension funds allocation to non-public equity is far too high and for too long. We believe the recent high-profile negative news on private equities will pressure them to relook at the illiquidity premium of these assets against an under-allocation of public equity.
In terms of geographical preferences, we prefer the US but have tilted the composition away from mega-cap tech names towards industrials and financials. Within tech, we are focused mainly on turnaround semiconductor plays. We have also deployed into several systematic alpha-generation ETFs that have outperformed the broader market consistently. The rest of our US equities are anchored by a quantitative long-short hedge fund and our in-house equity mandate. If you like to understand equity long-short hedge funds better, have a listen to our Spotify podcast, A long-short story about hedge funds. We downgrade our Japan equities overweight to neutral as we believe it is hard for Japan equities to outperform when the Yen strengthens. Our Japan expressions focus on activism and improving corporate governance. We have allocated more to European equities from the weights taken away from Japan equities, but it remains underweight alongside emerging markets largely on recession fears and greater dispersion and doubts on their 2024 earnings forecasts.
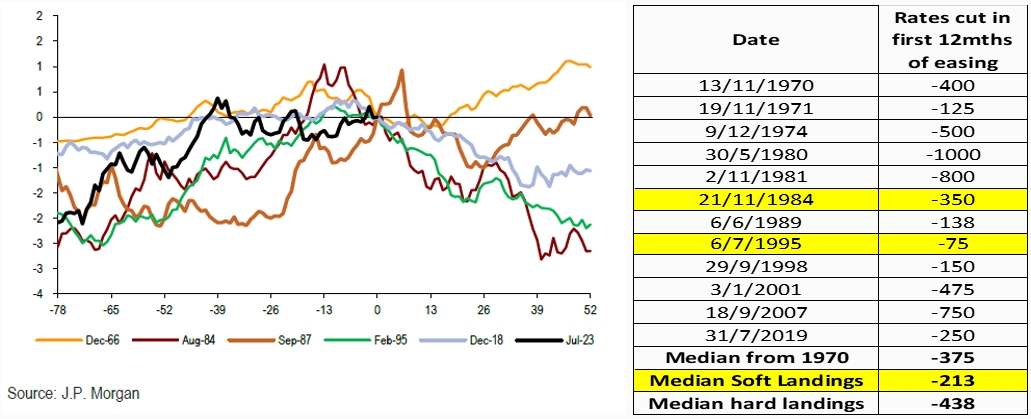
Fixed Income overweight in US Treasuries and Investment Grade. It is important to reiterate our body of work, The Indomitable Human Spirit, on policy rates and subsequent yields. In the last Navigator, we analyze the behavior of yields when the Fed stops hiking in non-recessionary cycles. We conclude 5 of 6 such episodes since 1966, the US10 yield falls and they fall as much as 200-300 bps nine months after the last hike. We have already seen a 100bps decline in the last two months. History guides us that the US10 yield should have another 50-100bps decline from now till the end of 2024. Furthermore, history also tells us that there is no such thing as a modest easing cycle. On average, the Fed cuts 375bps in 12months after they initiate the first cut. Even in the limited soft-landing scenarios the range of Fed fund rate cuts range from -75bps (the lowest on record) to -350bps. Our 100bps cuts does not seem too generous.
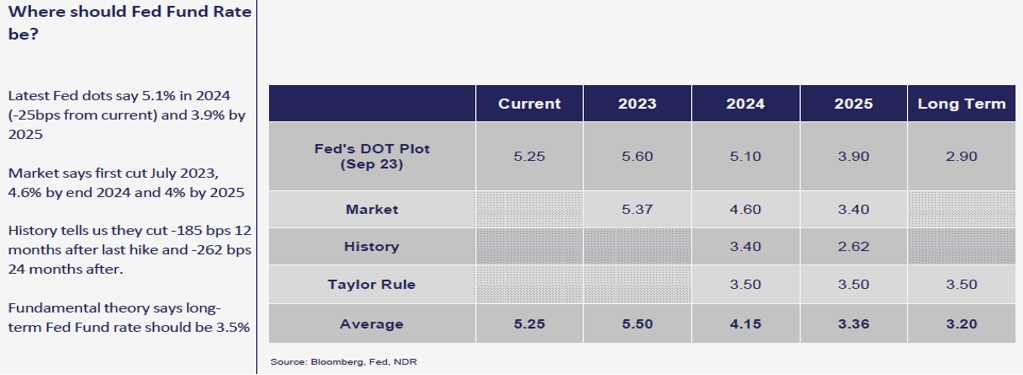
In our October bond webinar, we presented our four-pronged approach to estimate where the Fed Funds rate will be in 2024 and into 2025. Using a combination of the Fed’s dot plots, market pricing, empirical data from history, and academia theoretical work we provide a framework where the Fed Fund rate should fall from 5.25% currently to 4.15% in 2024 and 3.40% in 2025. If you would like to listen to our views expressed in the seminar, please speak to your wealth consultant for the link. We laid out our views on our preference for global investment grade bonds and exalted the unique partnership we have with one of the largest institutional fund managers in this space. At yield of 5.5% to 6%, investment-grade bonds provide an attractive carryover Treasury, fixed deposits, and inflation. We are not expecting further narrowing of credit spreads and much of the heavy lifting for capital gains in bonds will come from yields declining. For high-yield, we continue to eschew corporate credit due to unattractive spread differential between investment-grade and high-yield debt against a contrasting backdrop of rising defaults in the high-yield space and immaterial increase in the investment-grade issues. The preferences for high-yield fixed income assets include our uncorrelated returns in the private credit space as well as in the GSIB banks’ subordinated and hybrid capital structures.
Alternatives: Since 2018, our multi-strategy and multi-manager hedge fund strategy has produced respectable high-single digit return against a low volatility that is less than one-third of equities and half of bonds. Its returns are also less correlated and have low beta relative to the traditional stocks and bonds asset classes. We do think volatility will increase in 2024 as there will be up to forty elections occurring next year with the US Presidential election being the seminal event alongside Taiwan election in January. If you would like to find out more about this mandate, please also reach out to your wealth consultant.
FX: Only trade is to pick spots to long Yen. Even if BOJ does not end its ultra-loose policy, the commencement of policy easing by other developed market central banks should provide a bid for Yen.
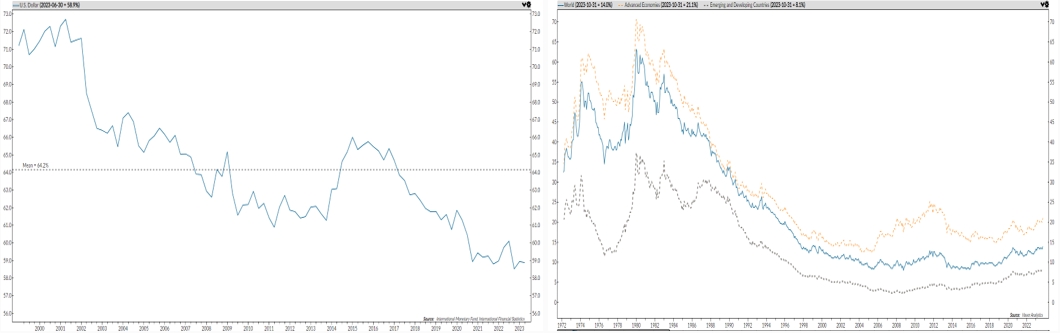
Commodities: A common question we face is the possibility of de-dollarization. While we are in the camp this is an inevitable outcome, history tells us this takes a long time to happen and there is no one cataclysmic event that leads to the precipitous decline of the prevailing preeminent currency. The US dollar is still the dominant holding in sovereign reserves though that has fallen from a high of 73% in 2000 to 59% now. We are watching Gold carefully as it is the most compelling alternative. Central bankers are underweight gold in their foreign reserves in the post Bretton-Woods collapse world and emerging market central banks have been increasing their stockpiles. Furthermore, the long-term technical resistance of gold has turned into a short-term technical support.
Cash: 0 to 5%. Lowest cash holdings in years.
Featured Picture/Quote: Reimagine Peace

Edward Lim, CFA
Chief Investment Officer
edwardlim@covenant-capital.com
Risk Disclosure
Investors should consider this report as only a single factor in making their investment decision. Covenant Capital (“CC”) may not have taken any steps to ensure that the securities or financial instruments referred to in this report are suitable for any particular investor. CC will not treat recipients as its customers by their receiving the report. The investments or services contained or referred to in this report may not be suitable for you and it is recommended that you consult an independent investment advisor if you are in doubt about such investments or investment services. Nothing in this report constitutes investment, legal, accounting, or tax advice or a representation that any investment or strategy is suitable or appropriate to your circumstances or otherwise constitutes a personal recommendation to you. The price, value of, and income from any of the securities or financial instruments mentioned in this report can fall as well as rise. The value of securities and financial instruments is affected by changes in a spot or forward interest and exchange rates, economic indicators, the financial standing of any issuer or reference issuer, etc., that may have a positive or adverse effect on the income from or the price of such securities or financial instruments. By purchasing securities or financial instruments, you may incur above the principal as a result of fluctuations in market prices or other financial indices, etc. Investors in securities such as ADRs, the values of which are influenced by currency volatility, effectively assume this risk.
By entering this site you agree to be bound by the Terms and Conditions of Use. COVENANT CAPITAL PTE LTD (“CCPL”) is a Capital Markets License (AI/II) holder and regulated by the Monetary Authority of Singapore (‘MAS’).
By using this site you represent and warrant that you are an accredited investor or institutional investor as defined in the Singapore Securities and Futures Act (Chapter 289). In using this site users represent that they are an accredited and/or Institutional investor and use this site for their own information purposes only.
The information provided on this website by Covenant Capital Pte Ltd (CCPL) is intended solely for informational purposes and should not be construed as investment advice. It does not constitute legal, tax, or other professional advice. CCPL strongly recommends consulting qualified professionals for personalized guidance. The website does not offer or solicit securities transactions, and users are expected to comply with local laws. Accredited and institutional investors in Singapore may access the information solely for informational purposes.
What types of Personal Data do Covenant Capital collect?
Personal data is any information that relates to an identifiable individual, and we may collect this information when you interact with our staffs:
1. Personal Particulars (e.g. name, address, date of birth)
2. Tax, Insurance and employment details
3. Banking information and financial details
4. Details of interactions with us (eg. Images, voice recordings, personal opinions)
5. Information obtained from mobile devices with your consent
How do we collect your Personal Data?
Below are the ways that we collect your data:
1. Investment Management Agreement forms, Risk Profile forms, Subscription forms;
2. Via emails, SMSes, Whatsapps, phone calls or any other digital means to the office or its’ staffs;
3. Photos and videos of you from our events; and
4. Information about your use of our services and website, including cookies and IP address
How do we use your Personal Data?
1. For General Support
Verify your identity before providing our services, or responding to any of your queries, feed-back and complaints.
2. For our Internal Operations
a. Aid our analysis so that the company can improve our services and products.
b. Manage the company’s day-to-day business operations.
c. Ensure that the information that the company have on you is current and up to date.
d. Conducting Due Diligence checks to reduce Money Laundering and Terrorist
3. Financing Schemes
e. Comply with all laws and obligations from any legal authorities.
f. Seek professional advice, including legal.
g. Provide updates to you.
4. Posting on LinkedIn and Website
We may post personal data, including pictures and videos, on our LinkedIn page and website for purposes such as:
Who do we share your Personal Data with?
1. Any officer or employee of the company and its related companies;
2. Third parties (and their sub-contractors if applicable) that works with us, such as Custodian Bank of choice, Fund Administrators for the Funds that we manage, any third party Fund’s Administrators, IT support who back up our database and other service providers;
3. Relevant authorities such as government or regulatory authorities, statutory bodies, law enforcement agencies.
4. Relevant authorities such as government or regulatory authorities, statutory bodies, law enforcement agencies.
5. We require all personnel of the company and third party to ensure that any of your data disclosed to them is kept confidential and secure
6. We do not sell your Personal Data to any third party, and we shall comply fully with any duty and obligation of confidentiality that governs our relationship with you
When the company discloses your personal data to third-parties, the company will, to the best of its abilities, exercise reasonable due diligence that they are contractually bound to protect your personal data in accordance with applicable laws and regulations, save in cases where by your personal data is publicly available.
Accessing and Correction Request and Withdrawal of Consent
Please contact your advisor/banker or alternatively you can contact ccops@covenant-capital.com should you have the following queries.
1. Regarding the company’s data protection policies and processes
2. Request access to and/or make corrections to your personal data in the company’s possession; or
3. Wish to withdraw your consent to our collection, use or disclosure of your personal data.
The company endeavours to respond to you within 30 days of the submission.
Should you choose to withdraw your consent to any or all use of your personal data, the company might not be able to continue to provide any further services or maintain further relationships. Such withdrawal may also result in the termination of any agreement or relationship that you have with us.
Complaints
If you wish to make a complaint with regards to the handling and treatment of your personal data, please contact the company’s Data Protection Officer, mentioned below, directly. The DPO shall contact you within 5 working days to provide you with an estimated timeframe for the investigation and resolution of your complaint.
Should the outcome of the resolution is not satisfactory, you may refer to the Personal Data Protection Commission (PDPC) for any further resolutions.
If you have any doubt, please contact Mr Tay Kian Ngiap, the PDPA Data Protection Officer for Covenant Capital Pte. Ltd. He can be reached at kntay@covenant-capital.com
By accessing this website, you hereby agree to the terms listed on the website, all applicable laws and regulations, and agree that you are responsible for compliance with any applicable local laws. Any claim relating to Covenant Capital’s website shall be governed by the laws of the Republic of Singapore without regard to its conflict of law provisions.
1. License to Use
Permission is granted to download information and materials on Covenant Capital’s website for personal, non-commercial viewing only. This is the grant of a license, not a transfer of title, and under this license you may not:
i) modify or copy the information and materials;
ii) use the information and materials for any commercial purpose, or for any public display (commercial or non- commercial);
iii) attempt to decompile or reverse engineer any software contained on Covenant Capital’s web site;
iv) remove any copyright or other proprietary notations from the materials; or
v) transfer the materials to another person or “mirror” the materials on any other server.
All content, including but not limited to logo, tagline, graphics, images, text contents, buttons, icons, design and structure are property of Covenant Capital. All content on this website is protected by copyright, patent and trademark laws.
The Covenant Capital logo should not be used for any purpose whatsoever beyond what is available on the website, unless you have obtained written approval from us.
2. Disclaimer
The materials on Covenant Capital’s website are provided “as is”. Covenant Capital makes no warranties, expressed or implied, and hereby disclaims and negates all other warranties, including without limitation, implied warranties or conditions of merchantability, fitness for a particular purpose, or non-infringement of intellectual property or other violation of rights. Further, Covenant Capital does not warrant or make any representations concerning the accuracy, likely results, or reliability of the use of the materials on its Internet web site or otherwise relating to such materials or on any sites linked to this site.
It is your responsibility to evaluate the accuracy, completeness, or usefulness of any information, advice and other content available through this website.
You should not solely rely on the information, advice and other contents available on our website for decisions on investment(s) or decision with respect to our company’s products and services. You are advised to seek additional information required for you to make sound, well-informed and reasonable decision.
3. Limitations
In no event shall Covenant Capital or its suppliers be liable for any damages (including, without limitation, damages for loss of data or profit, or due to business interruption,) arising out of the use, inability to use or user’s reliance on the materials obtained through Covenant Capital’s web site, even if Covenant Capital or a Covenant Capital authorized representative has been notified orally or in writing of the possibility of such damage.
4. No Offer
Nothing in this website constitutes a solicitation, an offer, or a recommendation to buy or sell any investment instruments, to effect any transactions, or to conclude any legal act of any kind whatsoever. The information on this web site is subject to change (including, without limitation, modification, deletion or replacement thereof) without prior notice. When making decision on investments, you are advised to seek additional information required for you to make sound, well-informed and reasonable decision.
5. Revisions and Errata
The materials appearing on Covenant Capital’s website may include technical, typographical, or photographic errors. Covenant Capital does not warrant that any of the materials on its website are accurate, complete, or current. Covenant Capital may make changes to the materials contained on its website at any time without notice. Covenant Capital does not, however, make any commitment to update the materials.
6. Site Terms of Use Modifications
Covenant Capital may revise these terms of use for its web site at any time without notice. By using this website you are agreeing to be bound by the then current version of these Terms and Conditions of Use. If any of the term or change is deemed not acceptable to you, you should not continue to browse this site.
Your privacy is very important to us and we respect your online privacy. This Policy has been developed in order for you to understand how we collect, use, communicate and disclose and make use of personal information. We are committed to conducting our business in accordance with these principles in order to ensure that the confidentiality of personal information is protected and maintained.
1. Collection and Use of Information
We may collect personal identifiable information, such as names, postal addresses, email addresses, etc., when voluntarily submitted by visitors to our website. This information is only used to fulfill your specific request, unless further permission is provided to us to use it in any other manner or for any other purpose.
2. Web Cookies / Tracking Technology
A cookie is a small file which seeks permission to be placed on your computer’s hard drive. Once you are agreeable to the use of cookies, the file is added and the cookie helps analyse web traffic and tracks visits to a particular website. Cookies allow web applications to respond to you as an individual. The web application can tailor its operations to your needs, likes and dislikes by gathering and remembering information about your preferences.
We use traffic log cookies to identify which pages are being used. This helps us analyse data about website traffic and improve our website in order to tailor it to customer needs. We only use this information for statistical analysis purposes and then the data is removed from the system.
Overall, cookies help us provide you with a better website by enabling us to monitor which pages you find useful and which you do not. A cookie in no way gives us access to your computer or any information about you, other than the data you choose to share with us.
You can choose to accept or decline cookies. Most web browsers automatically accept cookies, but you can usually modify your browser setting to decline cookies if you prefer. This may prevent you from taking full advantage of the website.
3. Links to other websites
Our website may contain links to other websites of interest. However, once you have used these links to leave our site, you should note that we do not have any control over that other website. Therefore, we cannot be responsible for the protection and privacy of any information that you provide whilst visiting such sites, and this privacy statement does not govern such sites. You should exercise caution and review the privacy statement applicable to that particular website.
4. Distribution of Information
We will not sell, distribute or lease your personal information to third parties unless we have your permission or are required by law to do so. We may use your personal information to send you promotional information about third parties’ products or services, which we think you may find interesting if you tell us that you wish this to happen.
If you believe that any information we are holding on you is incorrect or incomplete, please write to or email us as soon as possible at the above address. We will promptly correct any information found to be incorrect.
When required by law, we may share information with governmental agencies or other companies assisting in the investigations. The information is not provided to these companies for marketing purposes.
5. Commitment to Data Security
To make sure your personal information is secured, we communicate our privacy and security guidelines to all Covenant Capital’s employees and strictly enforce privacy safeguards within the company.
Your personal identifiable information is kept secure. Only authorised employees, agents and contractors who have a direct need to access the information will be able to view this information.
We reserve the right to make changes to this policy. Any changes to this policy will be posted.