


By Edward Lim
Continuing from the theme of music from the last Navigator, Folly of the Crowds, one of Radiohead’s most successful commercial hits was “High and Dry”. The song talks about the brevity of fame, the boorishness it cultivates, and eventually, the fleeting accolades that turn into disdain. While the song about China is still being written, there are some parallels of what has happened to China in the last 30 years of miraculous boom but with this success, it has also created large-scale excess across multiple sectors and bred a certain provincialism, both internally and in its interactions with neighboring nations. Reflecting on the song years later, when the lead vocalist remarked in an interview that it was “not a bad song, it was a really bad song.” The developments in the economic and political spheres in China in the last five years are increasingly looking like “a really bad song”. We see striking similarities between China’s future growth potential and Japan’s “lost decades” that began in the 1990s.
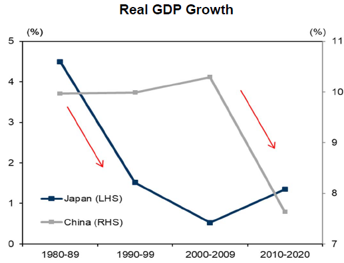
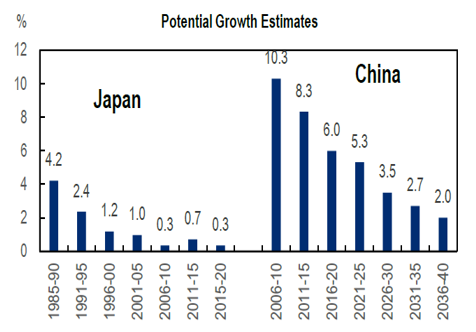
Japan, a decade before 1990, was a beacon of innovation and entrepreneurship with iconic products like the Sony Walkman and supercar Honda NXS. Even the famed Rockefeller Centre in New York was owned by Mitsubishi and Columbia Pictures was owned by Sony. Japan’s GDP grew by a compounded 1.83x from 1980-1990, faster than the US 1.08x. It accounted for 16% of the global GDP and was the second-largest economy after the US. However, in the subsequent decades, it saw a marked decline in economic growth slowing from 2.4% in 1991-1995 to stalling for much of the last 15 years. It lost its global stature with it share of the global pie falling to 4% and is a distant third from the US and China in terms of the size of their economies. China is also exhibiting the same growth trends slowing since its blistering pace as the economic liberalization goes into full swing from 2000 onwards embracing the Deng Xiaoping edict “to get rich is glorious”. However, in the last three years, growth has since slowed with its GDP growing below 5% pa. Based on a recent study by ADB, the institution forecasts China’s long-term growth prospect will slow even further to 3% pa and below into 2035.
China exhibiting same kind of growth trajectory as Japan back when it peaks in 1990
Source: IMF, CEIC, BOJ, ADB, Goldman Sachs
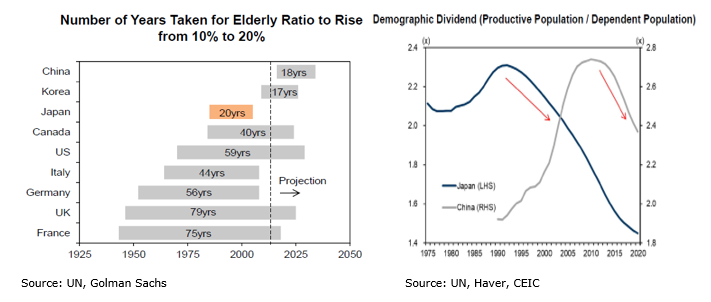
Demographics play a pivotal role in shaping a nation’s future growth prospects. In Japan, the population growth rate has slowed dramatically during this period. Before 1990, Japan’s working-age population was growing at an average rate of 1 to 2% pa, but by the turn of the decade, Japan’s working population growth rate had turned negative to -1% pa. China will experience the same dynamic as Japan but with a critical difference its population is aging faster than Japan. Japan’s population dividend peaked in 1983. Over t11 years from 1983- 1994, its share of the population above 65 grew from 10% in 1983 to 14%. China’s population dividend peaked in 2015, but it will reach the same ratio of 14% as Japan in a matter of 7 years. Thereafter, China’s total population started to decline while Japan population only declined in 2008, a good two decades from the time its population peak. The reason for China’s accelerating aging population is its One-Child policy implemented in 1980 which is also aggravated by its low population replacement rate (6th lowest in the world, 3 notches better than Singapore which is ranked the 3rd lowest). Compounding the possibility of China entering its own “lost decades” is that it will become old before it becomes rich. China’s GDP per capita of$12,800 in 2022 2.0x smaller than Japan’s GDP per capita back in 1994.
China is ageing fast and the working population will decrease faster than Japan post-bust
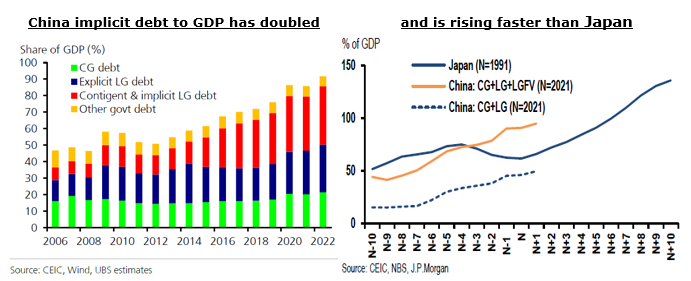
However, an aging demographics and an economy transitioning from an agrarian to an industrialized nation do not mean that the country will slip into an anemic growth cycle that lasts decades. There are several important accompanying requisites for that to happen. First, there must be an explosion of the country’s indebtedness that curtails future growth potential. In Japan, the government debt to GDP increased from less than 50% in 1990 to 130% by 2000 and has now reached 218%. During that period, Japan also saw an increase in both corporate and household debt with corporate debt increasing from less than 100% in 1980 to 150% by 1995 and its household debt rising from less than 50% in 1980 to 70% by 2000. Japan became a very indebted country on all fronts. The official figure of China’s debt to GDP obfuscates the fact that other borrowing entities like the local government and its financing vehicles are excluded. If we were to include them, China’s debt to GDP would have grown from less than 50% to 95% by end of 2022.
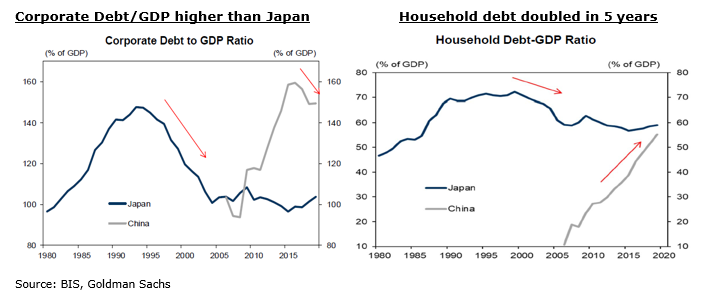
Like in Japan, China’s increase in debt extends beyond the government entities. We have also witnessed the proliferation of corporate and household debt. Post-GFC, China’s corporate debt-GDP increased substantially, and much of that debt binge went first into basic materials industries like steel and cement and flowed into the real estate market more recently. While the corporate debt-GDP has fallen lately as part of the central government’s deleveraging efforts, it still stands higher than peak level of Japan at 150%. But is the pace of that debt accumulation that should elicit references of excesses and state-sponsored not-for-profit oriented ventures. Their household debt has also more than doubled in the last five years and there are no prizes to guess where the borrowings were used for
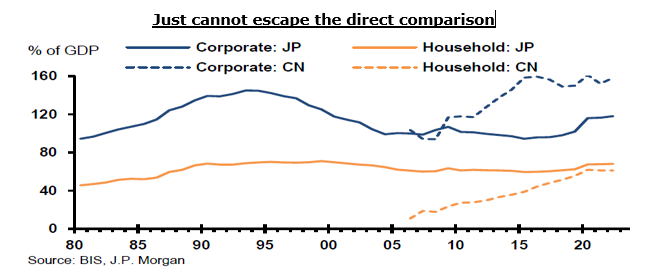
And if we combine the above analysis consisting of both private and public debt, China’s debt trajectory pre-post its real estate bubble looks frighteningly similar to Japan’s.
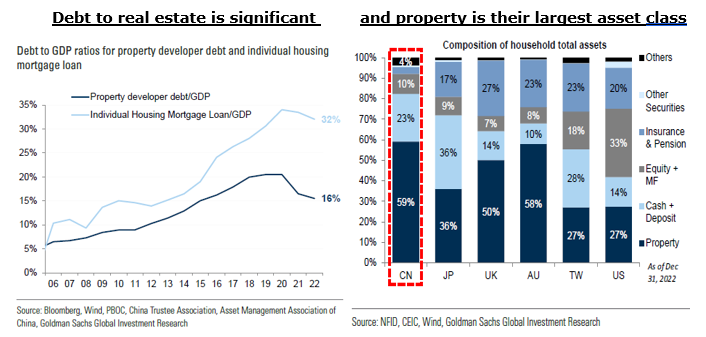
Some of my astute readers will point out that China’s real estate bubble is not the same as Japan’s as the former is residential real estate while the latter is commercial real estate. I would argue that debt is debt and excess is excess. Property developer debt and housing debt are 48% of its GDP. 75% of the property developer debt is held by the banks and all mortgages are originated by them too. The largest asset class for the Chinese is in property and at 59% of their total household assets it is far larger than Japan’s 36% and the US 27%. In other words, the average Chinese household is very susceptible to a real estate downturn in the residential market with much of their wealth in this asset class and much of its debt is related to housing. Just as it was for Japan with much of their corporate debt is linked to real estate and highly intertwined with its banking system. The longer this real estate crisis persists, the larger and longer-lasting damage it will exact on its economy. We recorded a podcast clamouring for a bazooka approach to this problem but so far, it has not been forthcoming. Have a listen on Spotify by clicking this link China Real Estate.
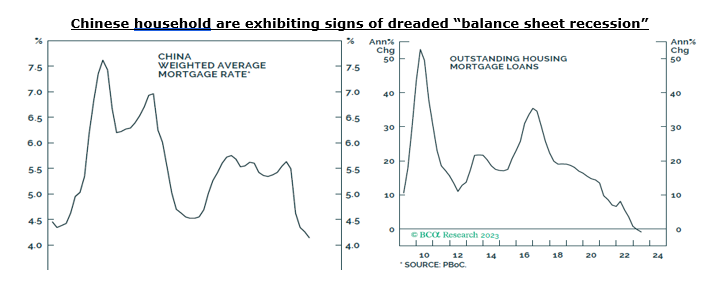
Another important prerequisite of China following Japan’s lost decades is the behaviour change of borrowers or as famously coined by Nomura’s chief economist Richard Koo, “a balance sheet recession” in which despite central bank ardent effort to reduce borrowing costs, borrowers are reticent to borrow and prefer to pay down debt, invest and consume lesser. We are already seeing early signs of this in China. The mortgage rate is at its lowest in more than a decade and yet home sales have slumped and even more intriguing, borrowers have been paying down their outstanding loans.
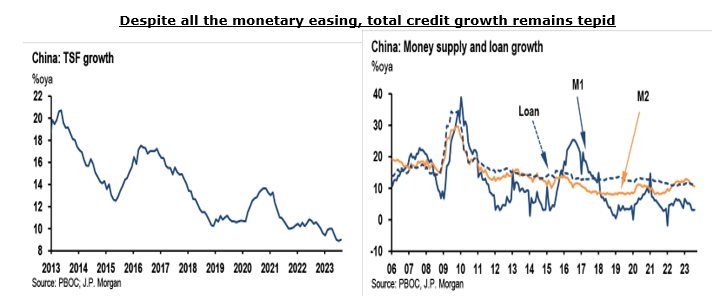
Since the start of the year, PBOC has utilized its entire suite of policy tools including cutting the Reserve Requirement Ratio twice freeing up RMB500bn yuan, reducing its 7-day repo once, easing several lending programs, enacting several housing-related relaxation measures, and using moral suasion to encourage the banks to lend. Yet, the Total Social Funding (the best indicator to gauge financing activities in China) have grown 9% only and the growth in the overall stock of loan have not changed throughout the year.
China also grapples with unique challenges that Japan did not face, such as strained relations with US and its allies. Their fractious relationship with the US and Euro has curbed its advancement in technology and diverted resources towards military deterrence than on much needed healthcare and social programs. It has also redrawn China’s global market opportunities along the lines of political ideologies.
However, it is essential to note that China has advantages and differences over Japan. There is still plenty of room on the monetary front as real rates are still positive and China does not have an inflation problem; arguably is in a deflationary quagmire that necessitates lower rates. It still has relatively healthier fiscal and current account balances to implement more monetary stimulus. There is still plenty of room to increase its capital stock to improve productivity even as its labour pool shrinks. Lastly, given that the central government is the major shareholder of many of the largest banks in the country, it has plenty of levers to pull including “persuading” the banks to lend more (is the only country that I know of which requires the banks to set yearly loan quota which are monitored for adherence or adjustments), and granting greater forbearance to the zombie companies.
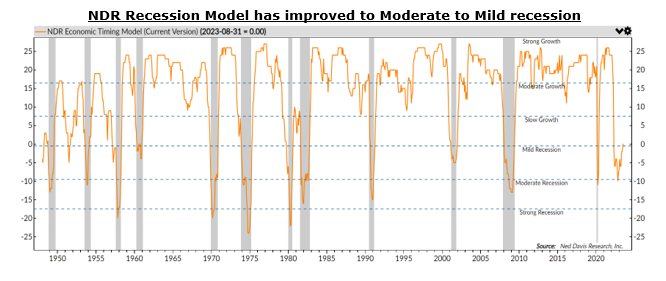
We have seen numerous commentators from both the buy and sell side capitulating from their view that US will enter a recession on the back of stronger-than-expected economic momentum in the last three quarters. As we have outlined in numerous publications, we have a systematic approach in ascertaining recession that uses a combination of economic nowcast and forecast models and indicators, market-driven signals, and bottom-up high-frequency anecdotal evidence. Updating all these factors, our case for a US recession remains unchanged even if it is pushed out for another 1 -2 quarters. As we have shared in the last Navigator, as long as the recession is shallow, the probability of SPX returning positive returns is high with 6 of out 8 such occasions returning an average of 9% returns. Based on the latest consensus forecast and NDR economic timing model, our base case remains a mild recession hence that forms our positive view of owning US Treasuries and still cautious view on equities.
Equities: Underweight but opportunities are appearing. In the last quarter, we have seen some improvement in the broadening of the S&P rally as well as the stabilization of earnings estimates for 2023 and 2024. Consensus is projecting EPS to grow 1% for 2023 and 11% for 2024 (last quarter’s consensus EPS growth forecast for 2023 and 2024 were -1% and +9%). Valuation remains our bugbear though September correction have improved with 12mths forward PE at 18x compared to the average of 16.5x since 2008. Investment community positioning is also no longer stretched. Our portfolio positioning has not changed much with the ongoing neutralization of our underweight in the US by adding single stock ideas in semiconductor and software, continue to be overweight in Japan and have added a new activist manager there, but remains underweight in Europe (the prospect of a longer recession) and Emerging Markets (China weighs heavy on our mind).
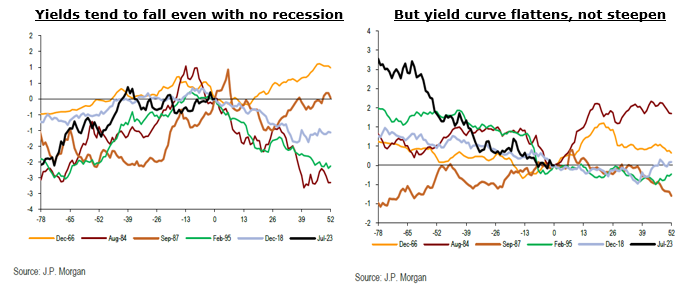
Fixed Income overweight in US Treasuries and Investment Grade. Yields have increased from the previous quarter and the asymmetry of returns has become more lucrative to own more. Moving away from our previous analysis where we know Treasury yields always fall if a recession occurs, we look at data to gauge what would likely happen if there were no recession but with a Fed ending its hiking cycle. Out of the 5 non-recessionary periods that followed a Fed tightening cycle since 1966, only on one occasion (1966) did yield rise within 4 months after the Fed stopped tightening. For the remaining 5 occasions, yields fell 200 to 300bps from the time the Fed stopped hiking till a good 9 months later therefore supporting our view to own Treasuries. However, in a non-recessionary outcome, the shape of the yield curve is less obvious. Most of the time, it flattens but there have been two occasions it bear steepens. This may dull the bull steepening construct we have in our portfolio but with 2-year Treasury yield at 5.10%, it does offer an attractive absolute yield.
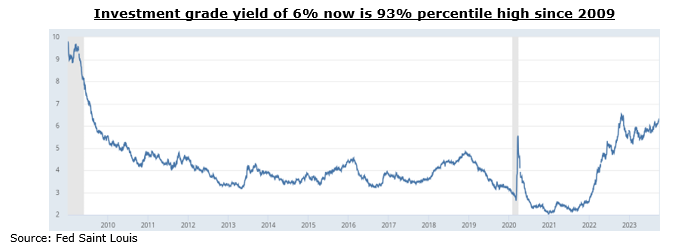
There has never been a better time than now to own investment-grade debt. Yield is now above 6% and there has only been 7% percentile of the time in the last 14 years that it has been higher. Such a level of yield only occurs in a severe recession but that is not our central thesis. Credit spreads have compressed in synchrony of stronger than expected growth momentum but if our base case gravitates towards a mild recession, we should not be expecting too large widening of credit spreads. At current yields, favourable bond price convexity comes into play.
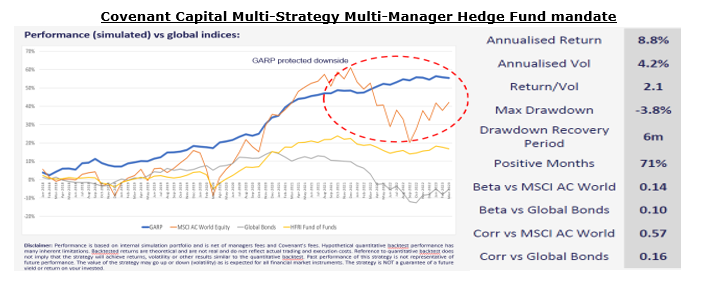
Alternatives: We have just launched a standalone multi-manager and multi-strategy hedge fund mandate. This is a cumulation of 8 years of due diligence and investing in them leveraging my more than 15 years of experience managing Asia long/short equities strategy. The multi-manager approach reduces manager concentration risk while the multi-strategy approach enhances return given the idiosyncratic characteristics of each strategy. The strategy has provided return of 9% pa since 2018, outperforming MSCI World Equities and the Global Hedge Fund indices significantly in terms of risk-adjusted returns. Correlation and beta read of the mandate with the broader market indices are low providing an uncorrelated return profile. We view this as a core hedge fund holding in our asset allocation mandates. Please speak to your wealth manager if you like to find out more about this opportunity.
FX: Likely range-bounded for the rest of the year as most developed central banks are at the end of their hiking cycle and will hold rates for a while longer. Key risks to watch are BOJ impending QT (which we believe will commence by early 1H24) and PBOC currency maneuvers.
Commodities: We took profit on our contrarian call of oil we had since Jan 23 as outlined in the 2023 strategy: The indomitable human spirit . The investment case for a bullish view for oil in the short-term remains with a resilient demand and OPEC compliance. But positioning has swiftly shifted from a very bearish view when shorts in oil contracts were at their all-time high back in June (higher than during covid and 2014-2015 oil collapse) to bullish now. When it comes to commodities, we should also look for extreme positioning and take a contrarian view when that happens. Sold all our oil futures and moved them to oil companies ETF because positioning in this 2nd derivatives remains dour.
Cash: Unchanged keeping some cash 10% to look for opportunities to bring our equities to overweight should the macro read necessitates that.
Dunning Krueger Effect. Bet you know someone at both ends. Click here if you think you already know what that is.
Edward Lim, CFA
Chief Investment Officer
edwardlim@covenant-capital.com
Risk Disclosure
Investors should consider this report as only a single factor in making their investment decision. Covenant Capital (“CC”) may not have taken any steps to ensure that the securities or financial instruments referred to in this report are suitable for any particular investor. CC will not treat recipients as its customers by their receiving the report. The investments or services contained or referred to in this report may not be suitable for you and it is recommended that you consult an independent investment advisor if you are in doubt about such investments or investment services. Nothing in this report constitutes investment, legal, accounting, or tax advice or a representation that any investment or strategy is suitable or appropriate to your circumstances or otherwise constitutes a personal recommendation to you. The price, value of, and income from any of the securities or financial instruments mentioned in this report can fall as well as rise. The value of securities and financial instruments is affected by changes in a spot or forward interest and exchange rates, economic indicators, the financial standing of any issuer or reference issuer, etc., that may have a positive or adverse effect on the income from or the price of such securities or financial instruments. By purchasing securities or financial instruments, you may incur above the principal as a result of fluctuations in market prices or other financial indices, etc. Investors in securities such as ADRs, the values of which are influenced by currency volatility, effectively assume this risk.
By entering this site you agree to be bound by the Terms and Conditions of Use. COVENANT CAPITAL PTE LTD (“CCPL”) is a Capital Markets License (AI/II) holder and regulated by the Monetary Authority of Singapore (‘MAS’).
By using this site you represent and warrant that you are an accredited investor or institutional investor as defined in the Singapore Securities and Futures Act (Chapter 289). In using this site users represent that they are an accredited and/or Institutional investor and use this site for their own information purposes only.
The information provided on this website by Covenant Capital Pte Ltd (CCPL) is intended solely for informational purposes and should not be construed as investment advice. It does not constitute legal, tax, or other professional advice. CCPL strongly recommends consulting qualified professionals for personalized guidance. The website does not offer or solicit securities transactions, and users are expected to comply with local laws. Accredited and institutional investors in Singapore may access the information solely for informational purposes.
What types of Personal Data do Covenant Capital collect?
Personal data is any information that relates to an identifiable individual, and we may collect this information when you interact with our staffs:
1. Personal Particulars (e.g. name, address, date of birth)
2. Tax, Insurance and employment details
3. Banking information and financial details
4. Details of interactions with us (eg. Images, voice recordings, personal opinions)
5. Information obtained from mobile devices with your consent
How do we collect your Personal Data?
Below are the ways that we collect your data:
1. Investment Management Agreement forms, Risk Profile forms, Subscription forms;
2. Via emails, SMSes, Whatsapps, phone calls or any other digital means to the office or its’ staffs;
3. Photos and videos of you from our events; and
4. Information about your use of our services and website, including cookies and IP address
How do we use your Personal Data?
1. For General Support
Verify your identity before providing our services, or responding to any of your queries, feed-back and complaints.
2. For our Internal Operations
a. Aid our analysis so that the company can improve our services and products.
b. Manage the company’s day-to-day business operations.
c. Ensure that the information that the company have on you is current and up to date.
d. Conducting Due Diligence checks to reduce Money Laundering and Terrorist
3. Financing Schemes
e. Comply with all laws and obligations from any legal authorities.
f. Seek professional advice, including legal.
g. Provide updates to you.
4. Posting on LinkedIn and Website
We may post personal data, including pictures and videos, on our LinkedIn page and website for purposes such as:
Who do we share your Personal Data with?
1. Any officer or employee of the company and its related companies;
2. Third parties (and their sub-contractors if applicable) that works with us, such as Custodian Bank of choice, Fund Administrators for the Funds that we manage, any third party Fund’s Administrators, IT support who back up our database and other service providers;
3. Relevant authorities such as government or regulatory authorities, statutory bodies, law enforcement agencies.
4. Relevant authorities such as government or regulatory authorities, statutory bodies, law enforcement agencies.
5. We require all personnel of the company and third party to ensure that any of your data disclosed to them is kept confidential and secure
6. We do not sell your Personal Data to any third party, and we shall comply fully with any duty and obligation of confidentiality that governs our relationship with you
When the company discloses your personal data to third-parties, the company will, to the best of its abilities, exercise reasonable due diligence that they are contractually bound to protect your personal data in accordance with applicable laws and regulations, save in cases where by your personal data is publicly available.
Accessing and Correction Request and Withdrawal of Consent
Please contact your advisor/banker or alternatively you can contact ccops@covenant-capital.com should you have the following queries.
1. Regarding the company’s data protection policies and processes
2. Request access to and/or make corrections to your personal data in the company’s possession; or
3. Wish to withdraw your consent to our collection, use or disclosure of your personal data.
The company endeavours to respond to you within 30 days of the submission.
Should you choose to withdraw your consent to any or all use of your personal data, the company might not be able to continue to provide any further services or maintain further relationships. Such withdrawal may also result in the termination of any agreement or relationship that you have with us.
Complaints
If you wish to make a complaint with regards to the handling and treatment of your personal data, please contact the company’s Data Protection Officer, mentioned below, directly. The DPO shall contact you within 5 working days to provide you with an estimated timeframe for the investigation and resolution of your complaint.
Should the outcome of the resolution is not satisfactory, you may refer to the Personal Data Protection Commission (PDPC) for any further resolutions.
If you have any doubt, please contact Mr Tay Kian Ngiap, the PDPA Data Protection Officer for Covenant Capital Pte. Ltd. He can be reached at kntay@covenant-capital.com
By accessing this website, you hereby agree to the terms listed on the website, all applicable laws and regulations, and agree that you are responsible for compliance with any applicable local laws. Any claim relating to Covenant Capital’s website shall be governed by the laws of the Republic of Singapore without regard to its conflict of law provisions.
1. License to Use
Permission is granted to download information and materials on Covenant Capital’s website for personal, non-commercial viewing only. This is the grant of a license, not a transfer of title, and under this license you may not:
i) modify or copy the information and materials;
ii) use the information and materials for any commercial purpose, or for any public display (commercial or non- commercial);
iii) attempt to decompile or reverse engineer any software contained on Covenant Capital’s web site;
iv) remove any copyright or other proprietary notations from the materials; or
v) transfer the materials to another person or “mirror” the materials on any other server.
All content, including but not limited to logo, tagline, graphics, images, text contents, buttons, icons, design and structure are property of Covenant Capital. All content on this website is protected by copyright, patent and trademark laws.
The Covenant Capital logo should not be used for any purpose whatsoever beyond what is available on the website, unless you have obtained written approval from us.
2. Disclaimer
The materials on Covenant Capital’s website are provided “as is”. Covenant Capital makes no warranties, expressed or implied, and hereby disclaims and negates all other warranties, including without limitation, implied warranties or conditions of merchantability, fitness for a particular purpose, or non-infringement of intellectual property or other violation of rights. Further, Covenant Capital does not warrant or make any representations concerning the accuracy, likely results, or reliability of the use of the materials on its Internet web site or otherwise relating to such materials or on any sites linked to this site.
It is your responsibility to evaluate the accuracy, completeness, or usefulness of any information, advice and other content available through this website.
You should not solely rely on the information, advice and other contents available on our website for decisions on investment(s) or decision with respect to our company’s products and services. You are advised to seek additional information required for you to make sound, well-informed and reasonable decision.
3. Limitations
In no event shall Covenant Capital or its suppliers be liable for any damages (including, without limitation, damages for loss of data or profit, or due to business interruption,) arising out of the use, inability to use or user’s reliance on the materials obtained through Covenant Capital’s web site, even if Covenant Capital or a Covenant Capital authorized representative has been notified orally or in writing of the possibility of such damage.
4. No Offer
Nothing in this website constitutes a solicitation, an offer, or a recommendation to buy or sell any investment instruments, to effect any transactions, or to conclude any legal act of any kind whatsoever. The information on this web site is subject to change (including, without limitation, modification, deletion or replacement thereof) without prior notice. When making decision on investments, you are advised to seek additional information required for you to make sound, well-informed and reasonable decision.
5. Revisions and Errata
The materials appearing on Covenant Capital’s website may include technical, typographical, or photographic errors. Covenant Capital does not warrant that any of the materials on its website are accurate, complete, or current. Covenant Capital may make changes to the materials contained on its website at any time without notice. Covenant Capital does not, however, make any commitment to update the materials.
6. Site Terms of Use Modifications
Covenant Capital may revise these terms of use for its web site at any time without notice. By using this website you are agreeing to be bound by the then current version of these Terms and Conditions of Use. If any of the term or change is deemed not acceptable to you, you should not continue to browse this site.
Your privacy is very important to us and we respect your online privacy. This Policy has been developed in order for you to understand how we collect, use, communicate and disclose and make use of personal information. We are committed to conducting our business in accordance with these principles in order to ensure that the confidentiality of personal information is protected and maintained.
1. Collection and Use of Information
We may collect personal identifiable information, such as names, postal addresses, email addresses, etc., when voluntarily submitted by visitors to our website. This information is only used to fulfill your specific request, unless further permission is provided to us to use it in any other manner or for any other purpose.
2. Web Cookies / Tracking Technology
A cookie is a small file which seeks permission to be placed on your computer’s hard drive. Once you are agreeable to the use of cookies, the file is added and the cookie helps analyse web traffic and tracks visits to a particular website. Cookies allow web applications to respond to you as an individual. The web application can tailor its operations to your needs, likes and dislikes by gathering and remembering information about your preferences.
We use traffic log cookies to identify which pages are being used. This helps us analyse data about website traffic and improve our website in order to tailor it to customer needs. We only use this information for statistical analysis purposes and then the data is removed from the system.
Overall, cookies help us provide you with a better website by enabling us to monitor which pages you find useful and which you do not. A cookie in no way gives us access to your computer or any information about you, other than the data you choose to share with us.
You can choose to accept or decline cookies. Most web browsers automatically accept cookies, but you can usually modify your browser setting to decline cookies if you prefer. This may prevent you from taking full advantage of the website.
3. Links to other websites
Our website may contain links to other websites of interest. However, once you have used these links to leave our site, you should note that we do not have any control over that other website. Therefore, we cannot be responsible for the protection and privacy of any information that you provide whilst visiting such sites, and this privacy statement does not govern such sites. You should exercise caution and review the privacy statement applicable to that particular website.
4. Distribution of Information
We will not sell, distribute or lease your personal information to third parties unless we have your permission or are required by law to do so. We may use your personal information to send you promotional information about third parties’ products or services, which we think you may find interesting if you tell us that you wish this to happen.
If you believe that any information we are holding on you is incorrect or incomplete, please write to or email us as soon as possible at the above address. We will promptly correct any information found to be incorrect.
When required by law, we may share information with governmental agencies or other companies assisting in the investigations. The information is not provided to these companies for marketing purposes.
5. Commitment to Data Security
To make sure your personal information is secured, we communicate our privacy and security guidelines to all Covenant Capital’s employees and strictly enforce privacy safeguards within the company.
Your personal identifiable information is kept secure. Only authorised employees, agents and contractors who have a direct need to access the information will be able to view this information.
We reserve the right to make changes to this policy. Any changes to this policy will be posted.
